With the cemeteries in Amherst making headlines in local news, I thought it was appropriate to obtain some numbers on the historic demand for the town’s cemetery land. The actual number of burials per year are only one facet of the issue, though. The other big aspect, which has not been a part of public discussion as I am aware of it, is the sale of burial plots. I am also working on those data in order to provide a more complete picture of our resource demands. That will have to wait, though. (Note: Now complete.)
The town’s Department of Public Works has been very helpful with providing access to the town’s burial records (for which I am most appreciative), which go back to 1934 and are graphed below. These data conclude with the current year’s burial numbers, which, this being May, should be understood to be incomplete.
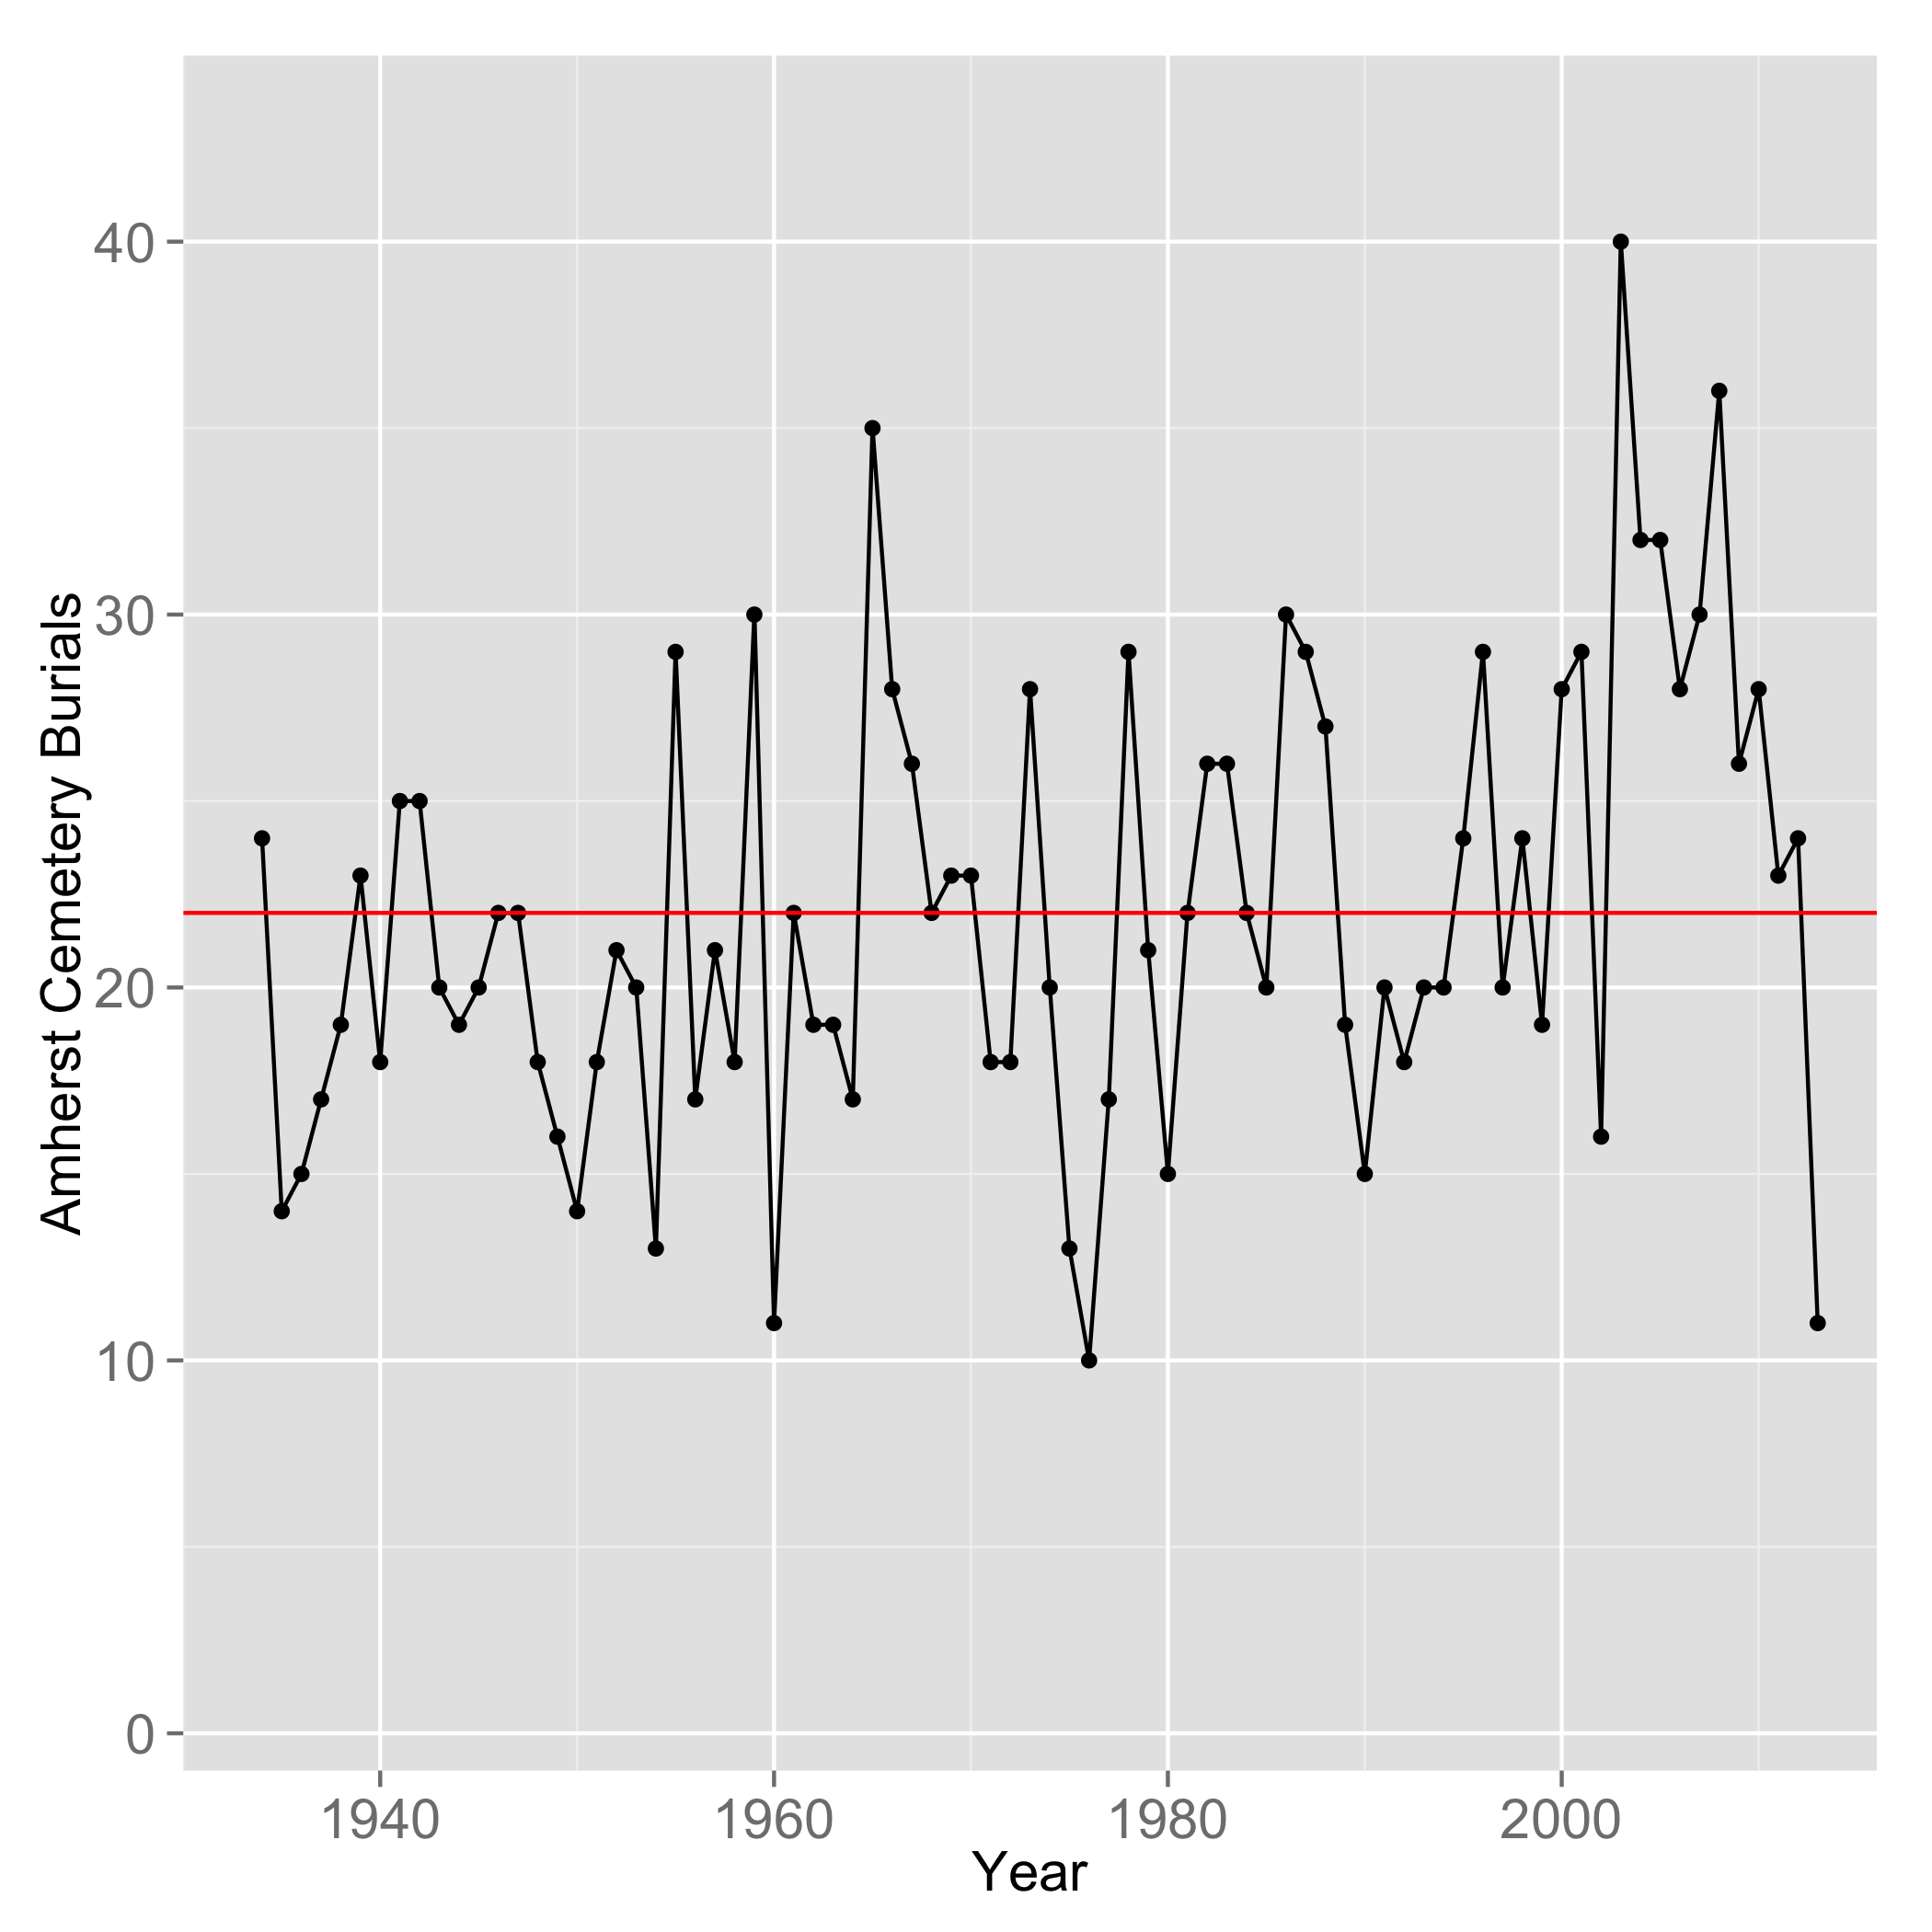
Annual number of burials in Amherst, NH cemeteries. Data from Department of Public Works records.
This graph nicely shows the fluctuations in the annual interment rates, and indicates that the data set is well represented by its mean value (red line). In order to make some other comparisons, however, we can determine the average number of burials per year, averaged over a decade, and replot. The graph below shows the average number of burials per year in the decade preceding the data point. So the 20.5 value in 1950 is the average number of burials from 1940-1949, and so on. The trend was clearly upward for the 2000-2010 decade, though it has fallen back to an average of 25 since 2010, as the graph above illustrates (not counting this year for obvious reasons).
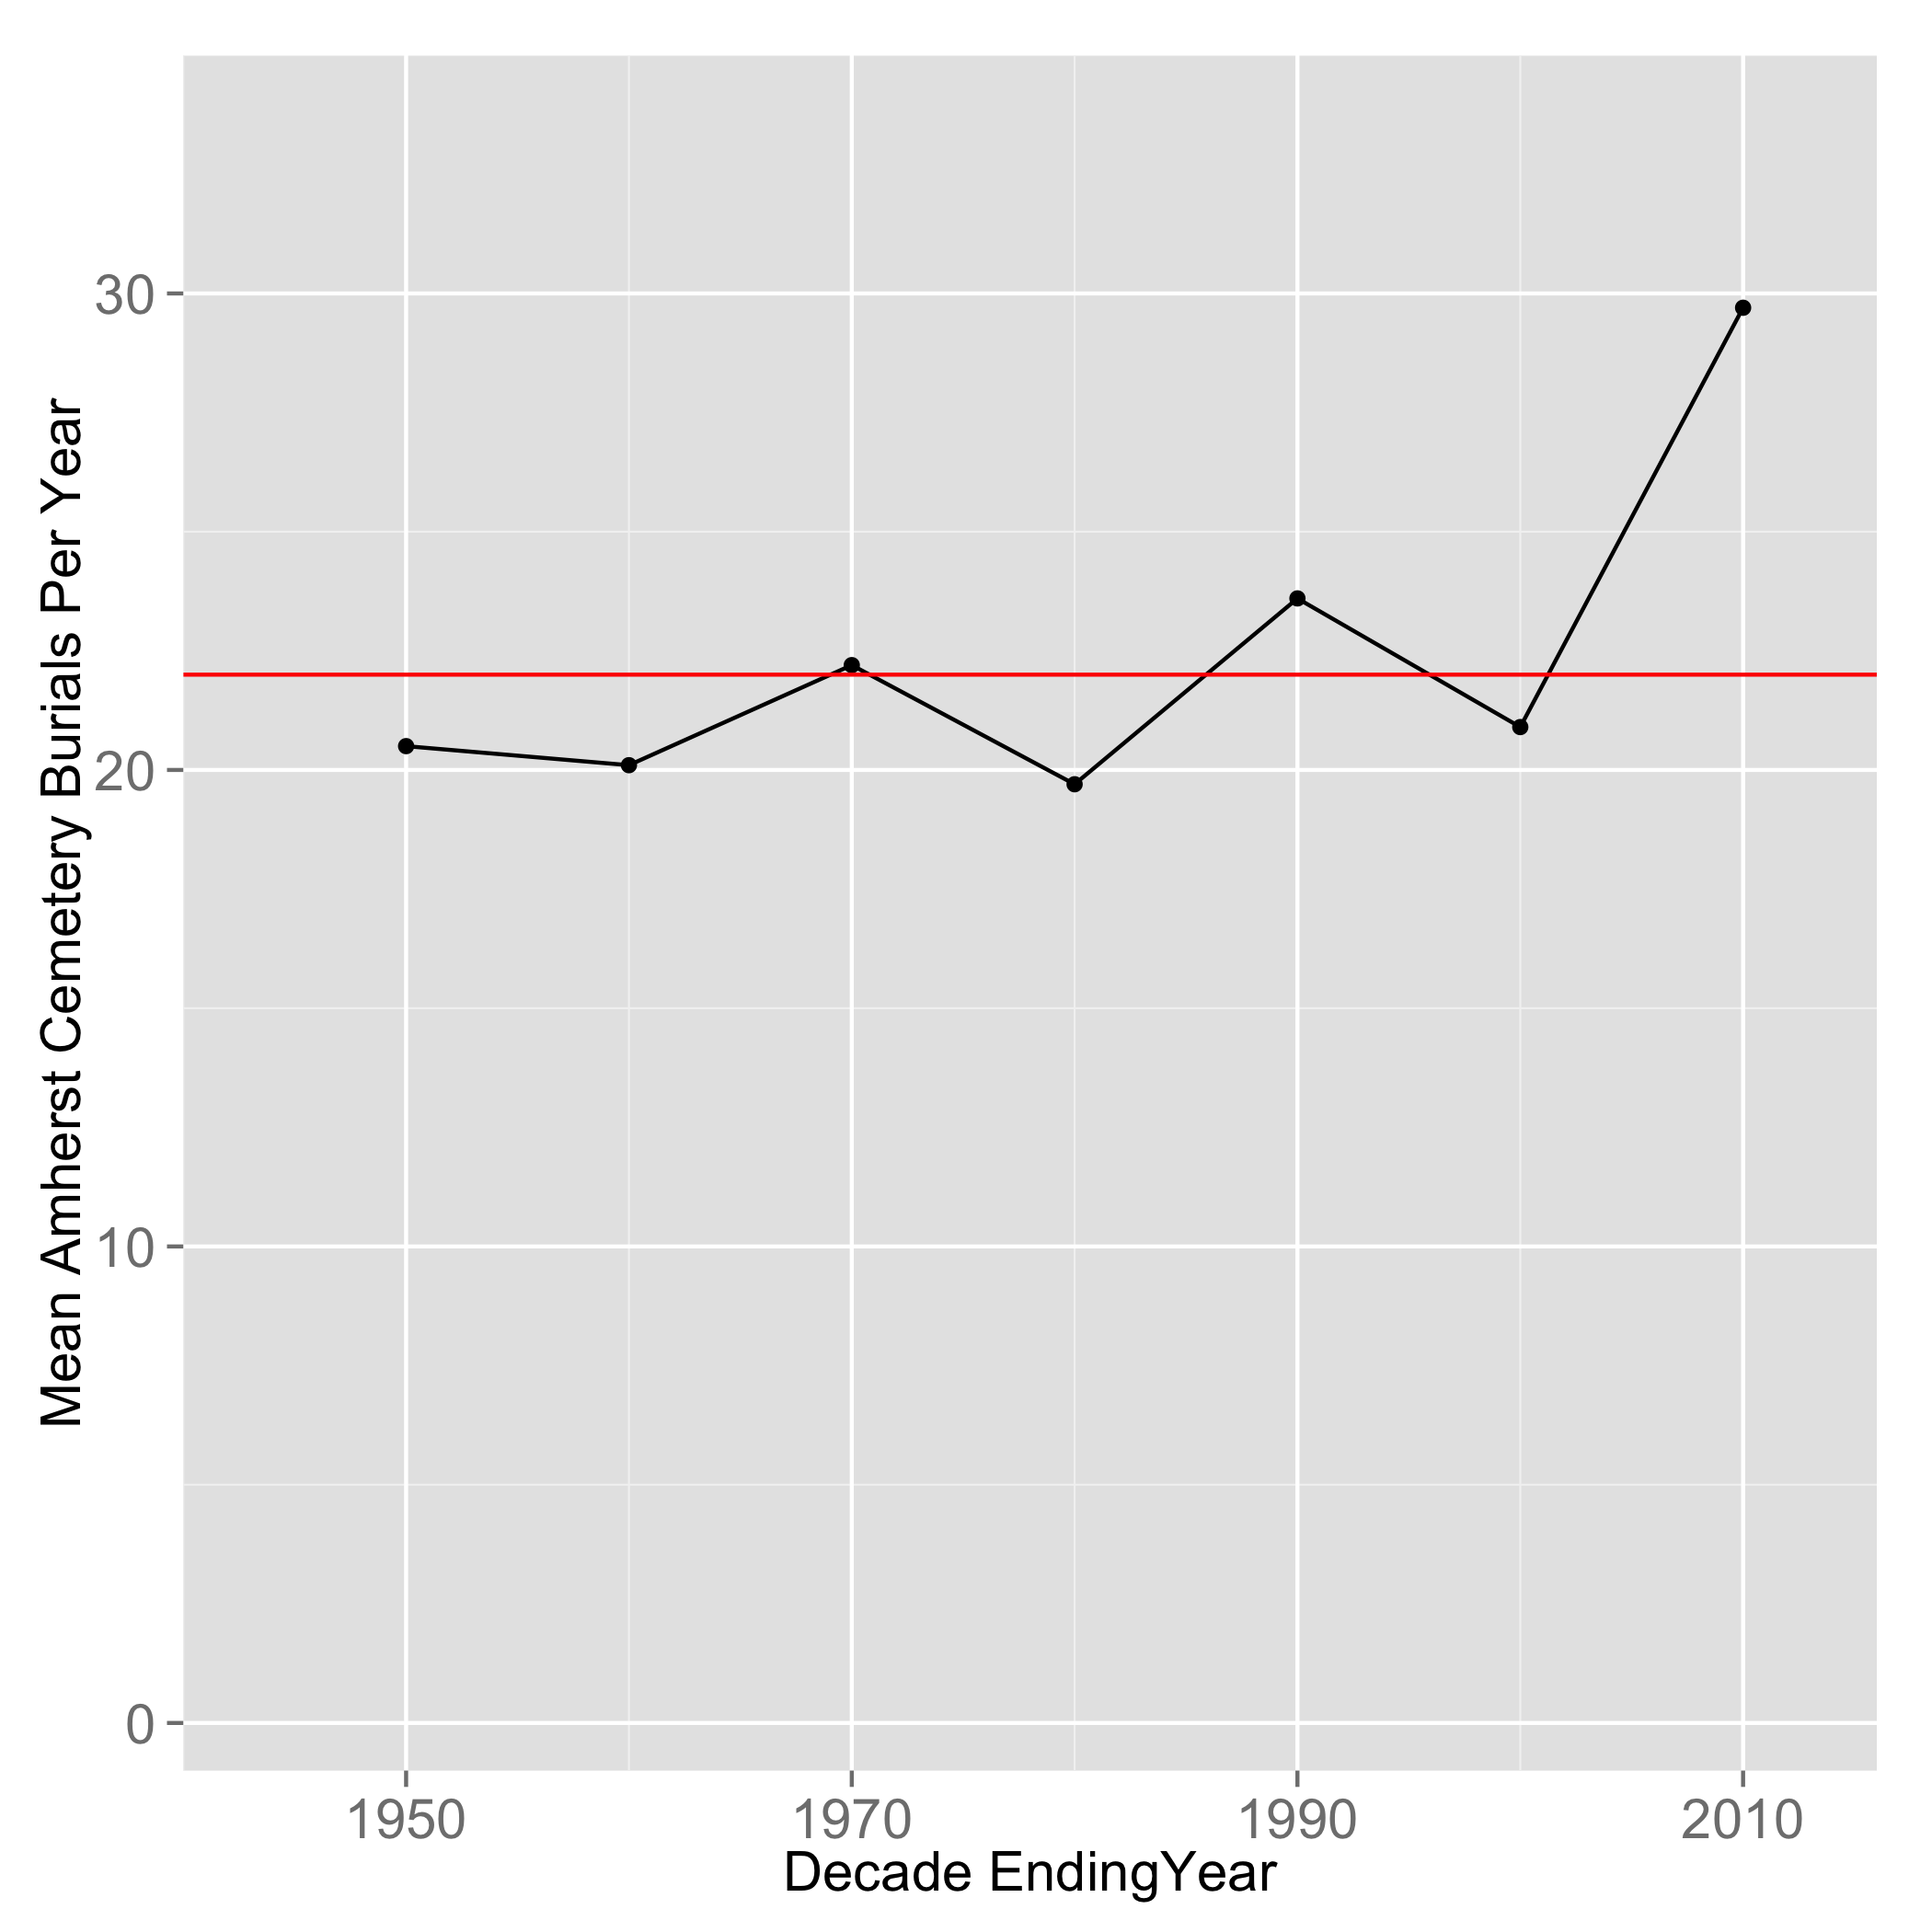
Annualized mean burials in Amherst, NH cemeteries.
In a previous post on the town’s population growth, the US Census was the primary source of data. There, the information is on the decade years and showed Amherst’s considerable growth. I have replotted these Amherst population data below, restricting the graph to just the years for which I have burial data. In the 60 years shown here, the population of the town increased from 1461 to 11,201 (by count of the US Census department).
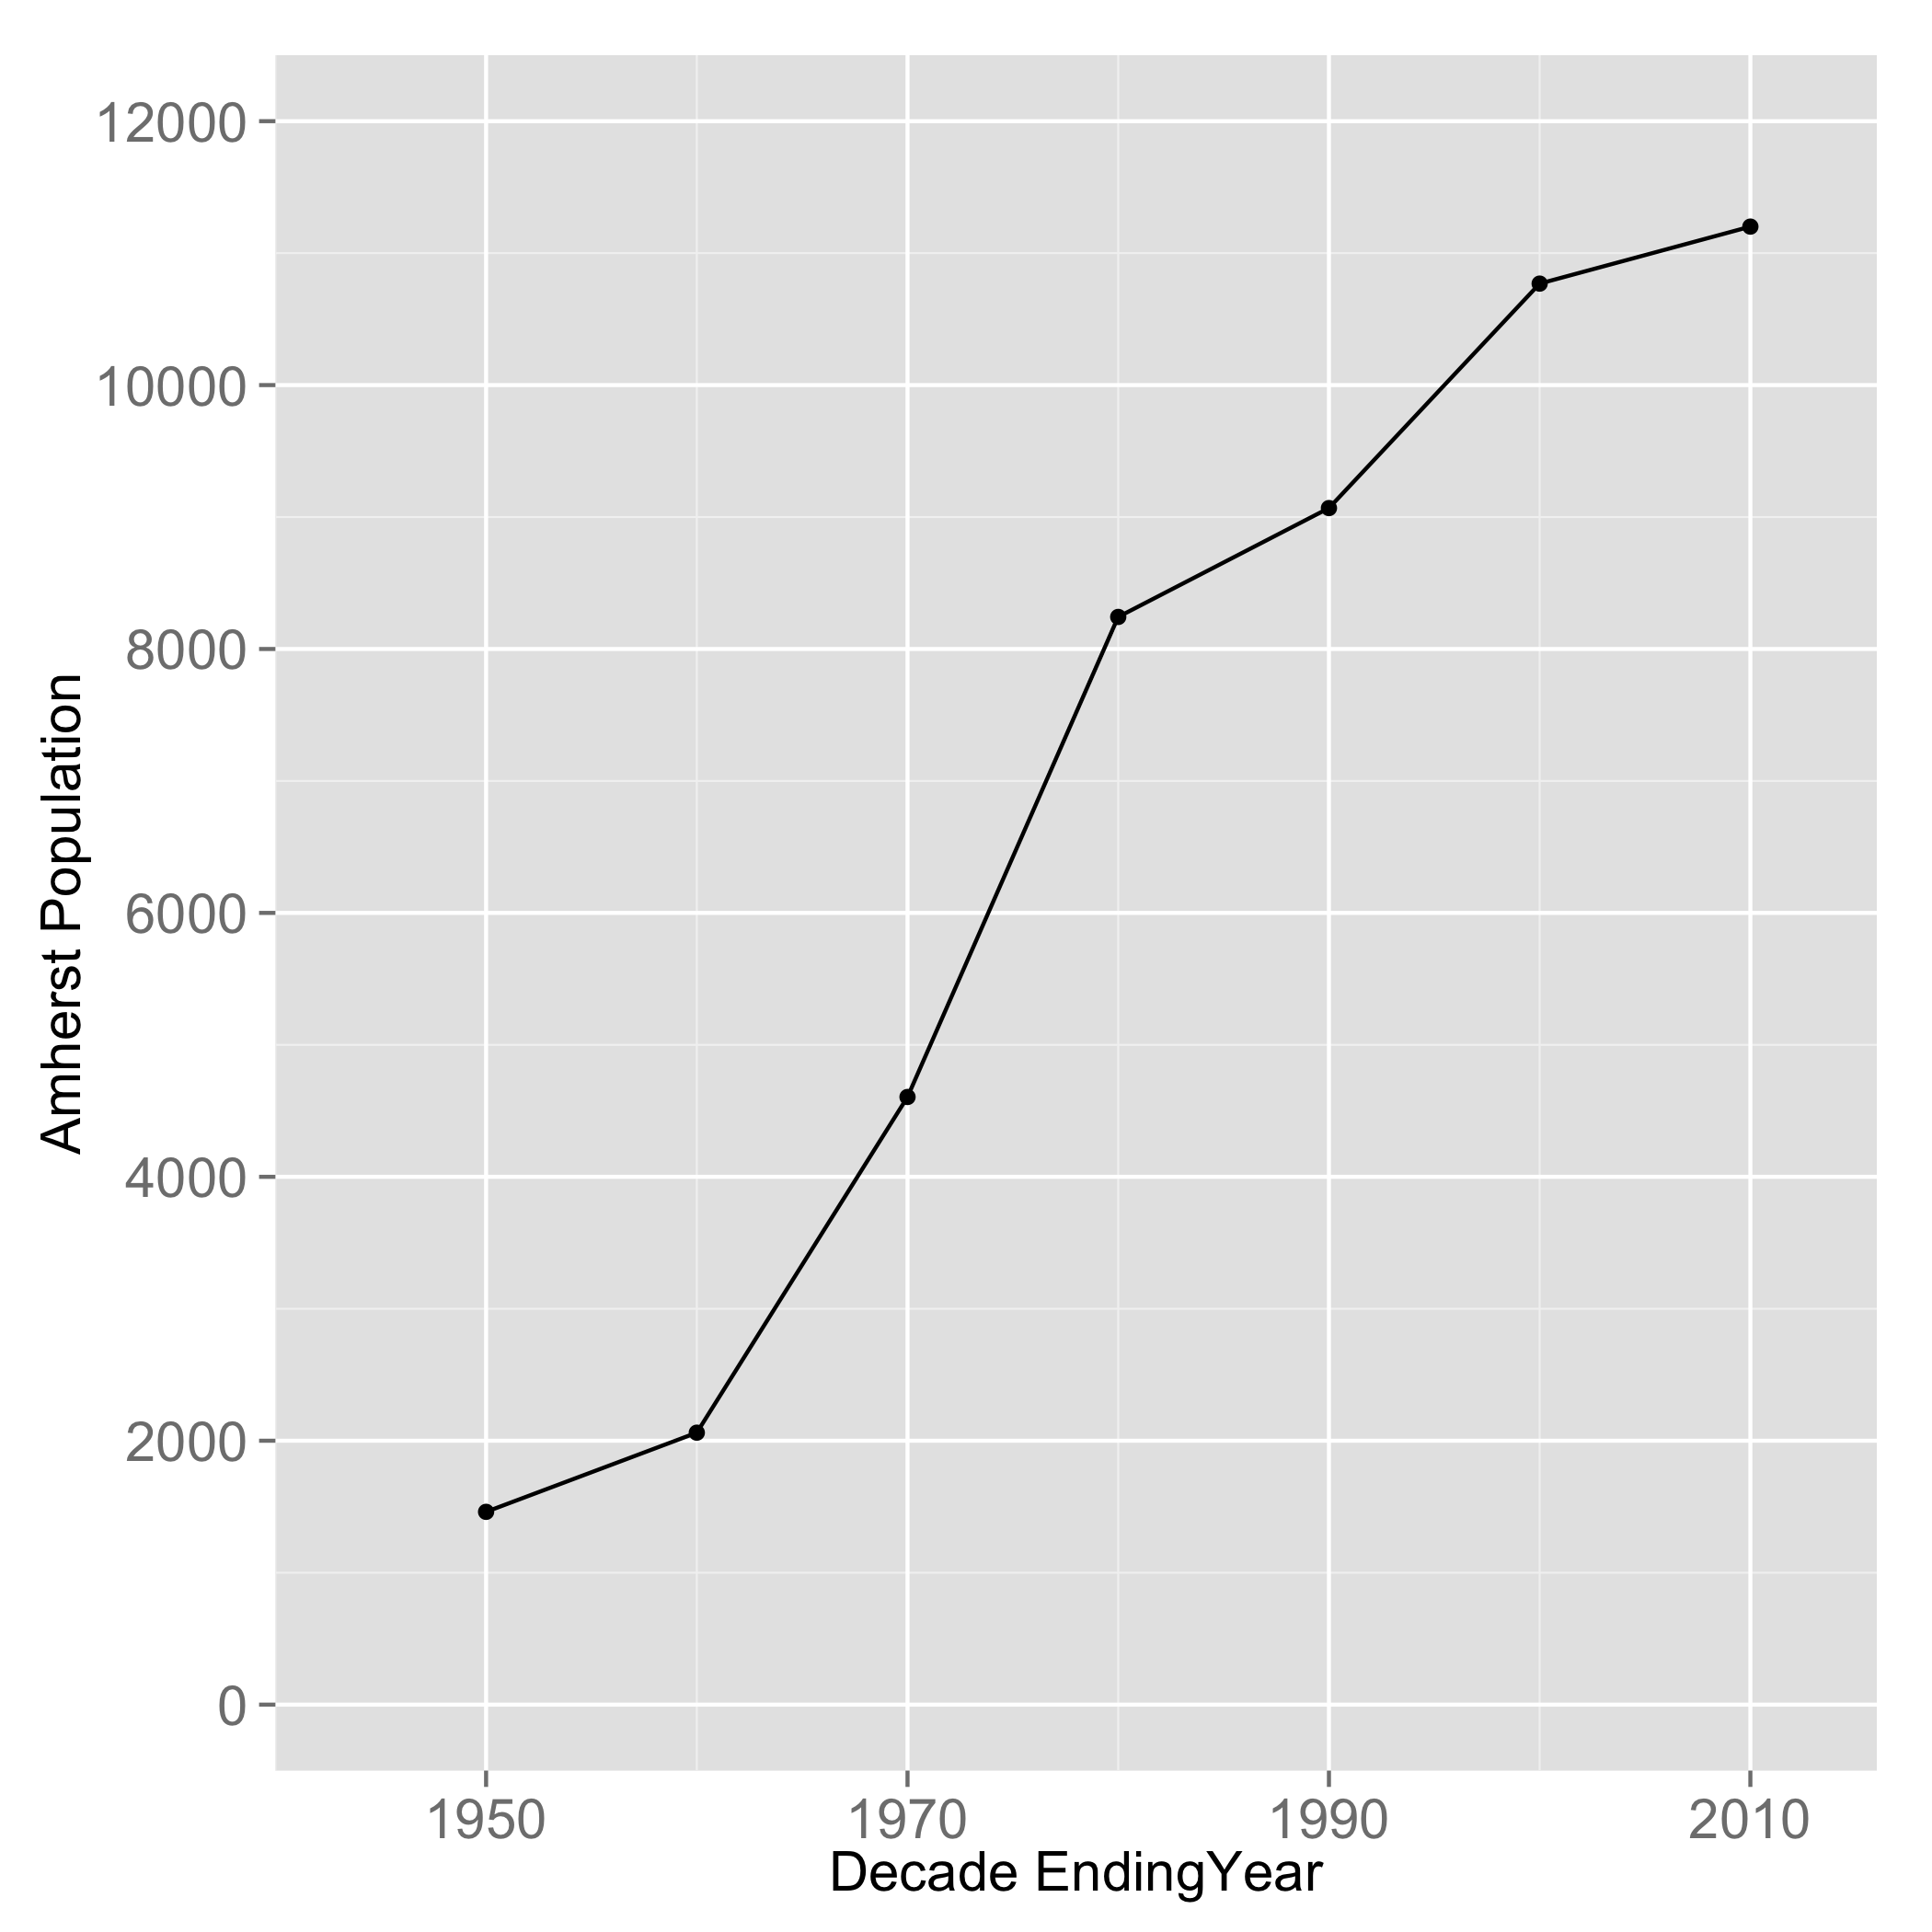
US Census population data for Amherst during the burial data years.
The remarkable thing about this is that with the 766% increase in population of the town (2010 vs. 1950), the interment rate has remained largely flat. In other words, a shrinking percentage of the town’s population is being interred over this time, as shown graphically below. This should not be confused with our absolute burial space demand, which is clearly demonstrated by the first graph in this post.
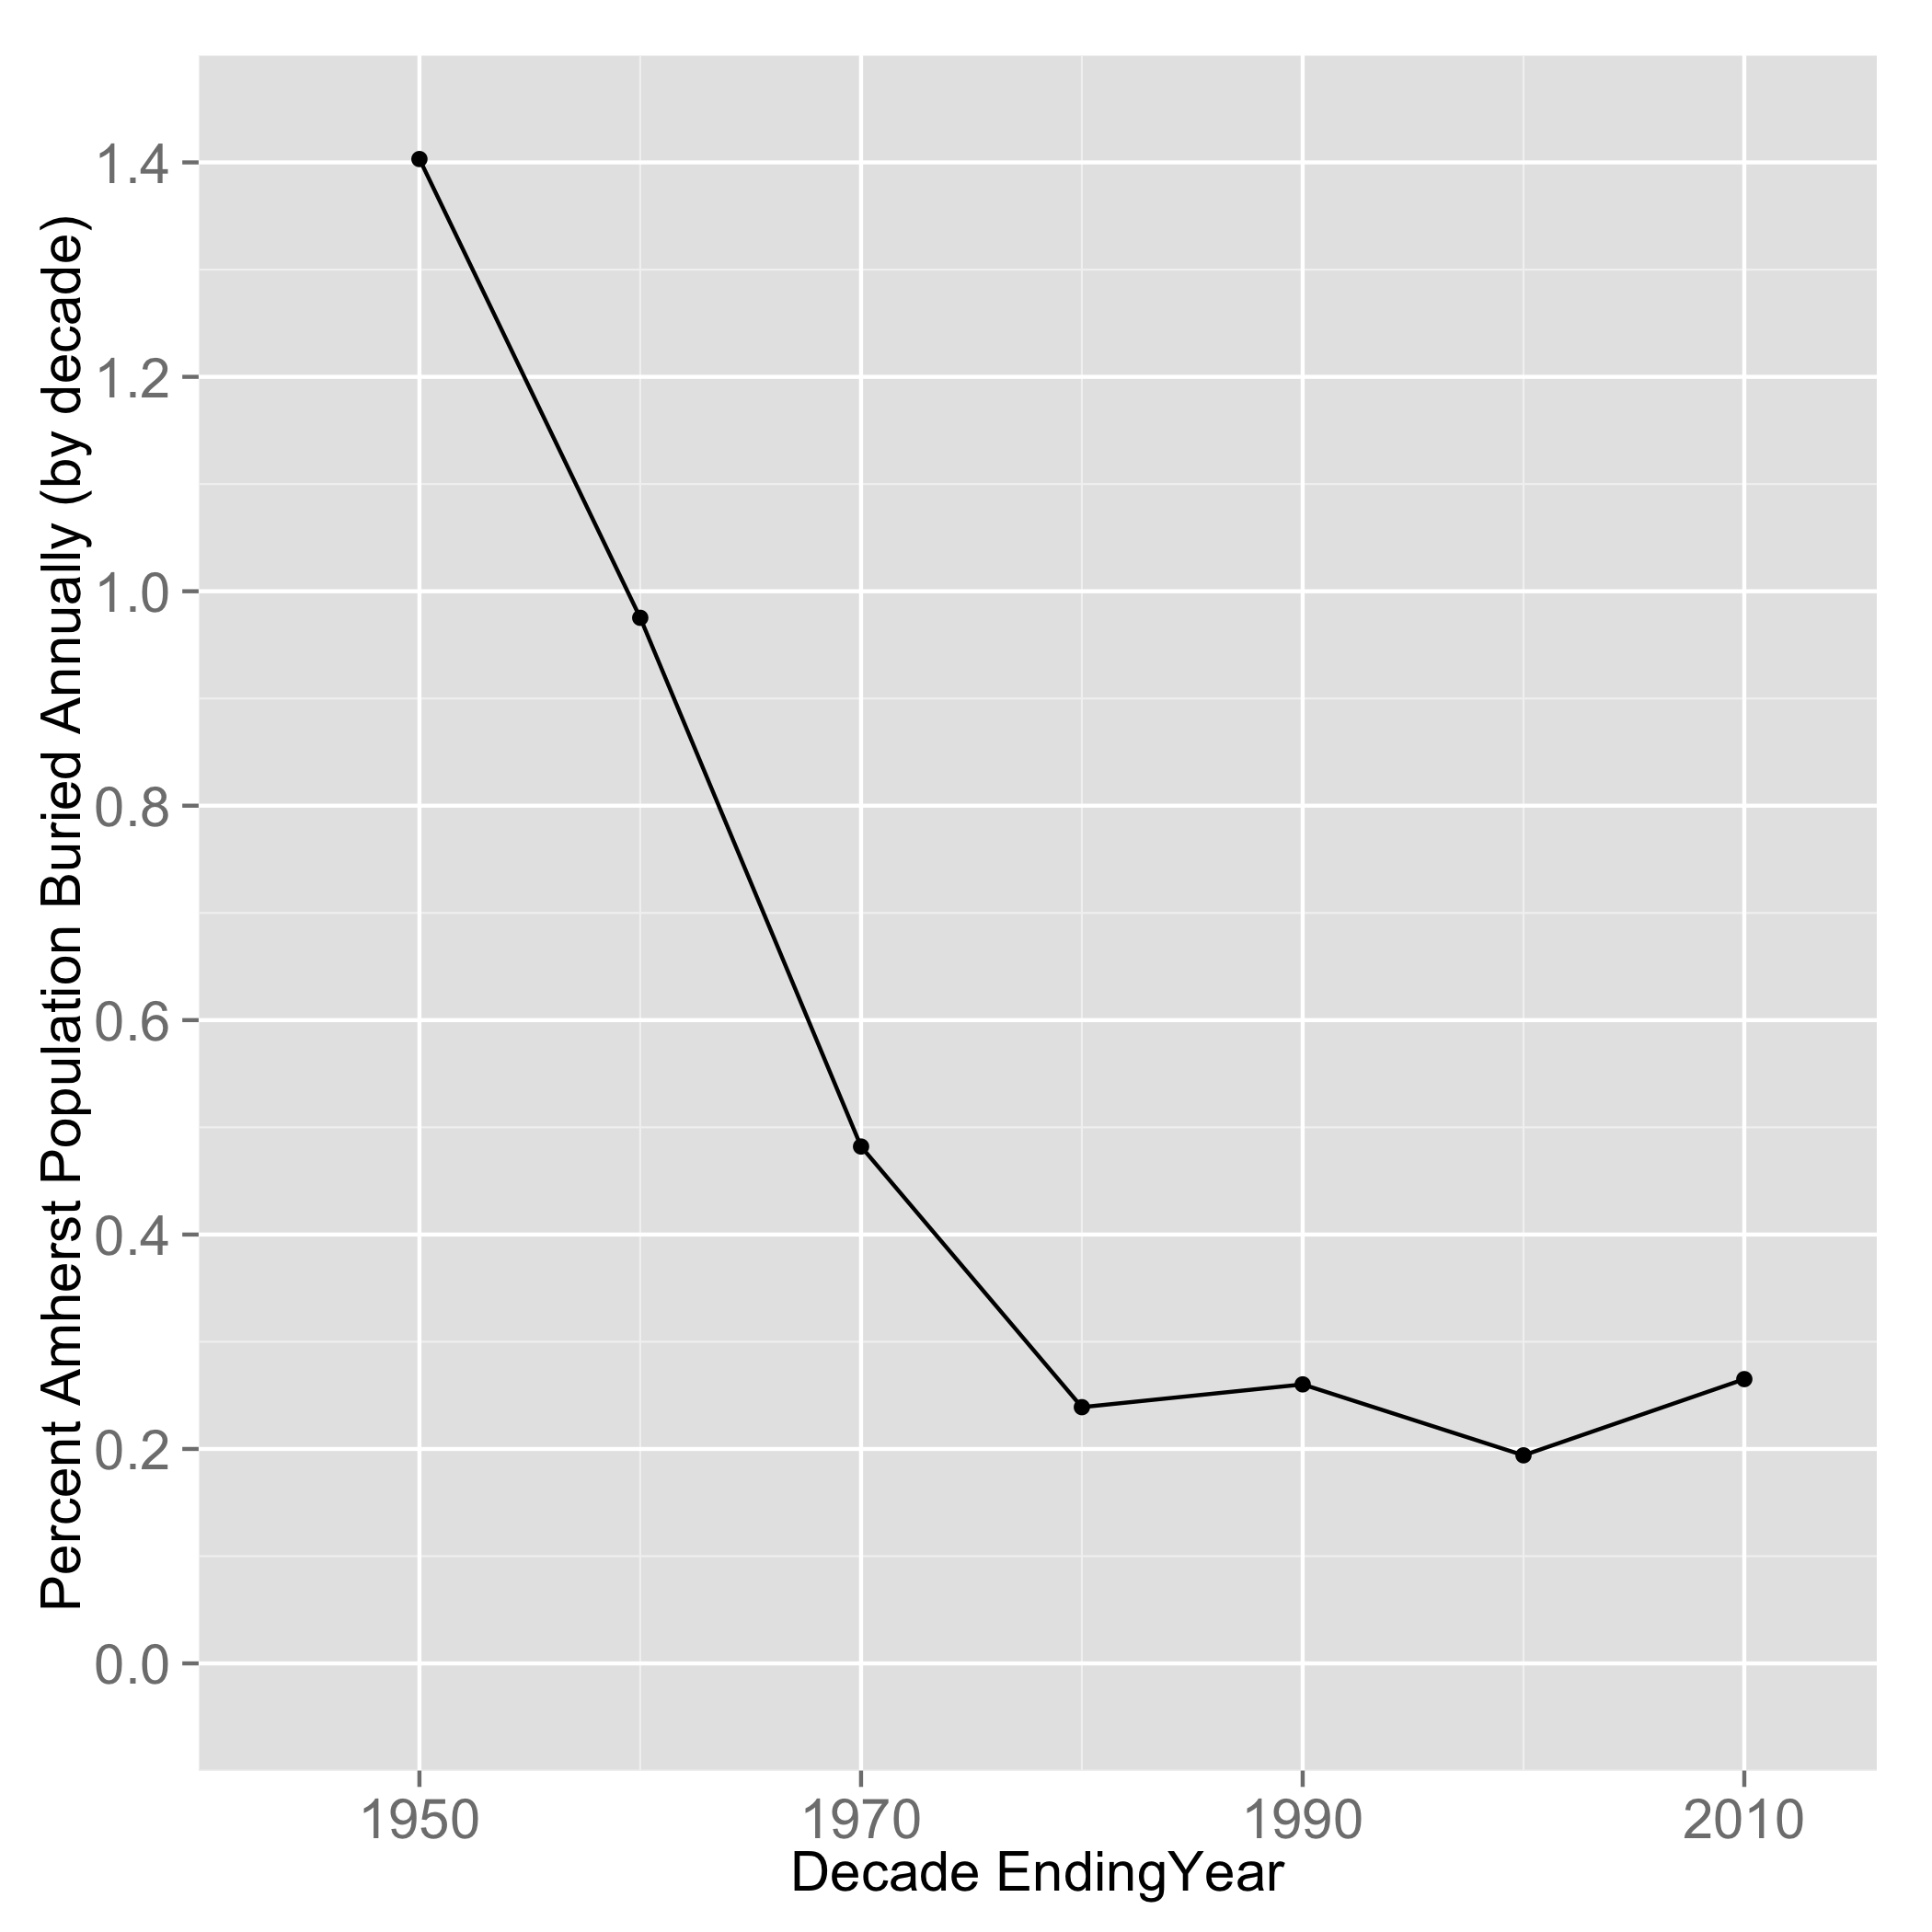
Percentage of the population of Amherst buried, averaged for each decade.
This is a very surprising result. And probably not attributable to longevity, although life expectancy numbers in the US have increased (see below). I have no numbers on cremation or private cemetery usage, but those are likely possible factors in play.

Historic life expectancy in the United States.
What the population and interment numbers do tell us is that there are more of us in town every year, but a relatively fixed number of us are buried here annually.
