Some years ago I was involved in budget evaluation for one of the town’s school districts. I was asked to extend a budget analysis I did back then to include recent data. I’d take it back farther, but I don’t have older data.
First thing first. Data comes from the numbers reported by the state. Scroll down to “Valuations, Property Tax Assessments, and School Tax Rates.” I made one tiny change when updating this set of data in that previously I called 2000-2001 data FY2001 while I recognized that the state just indicates it to be from 2000. So the dates are back shifted by 1 year in these updates to be consistent with how the state reported the numbers. Constant dollar calculations come from Consumer Price Index data from the US Bureau of Labor Statistics.
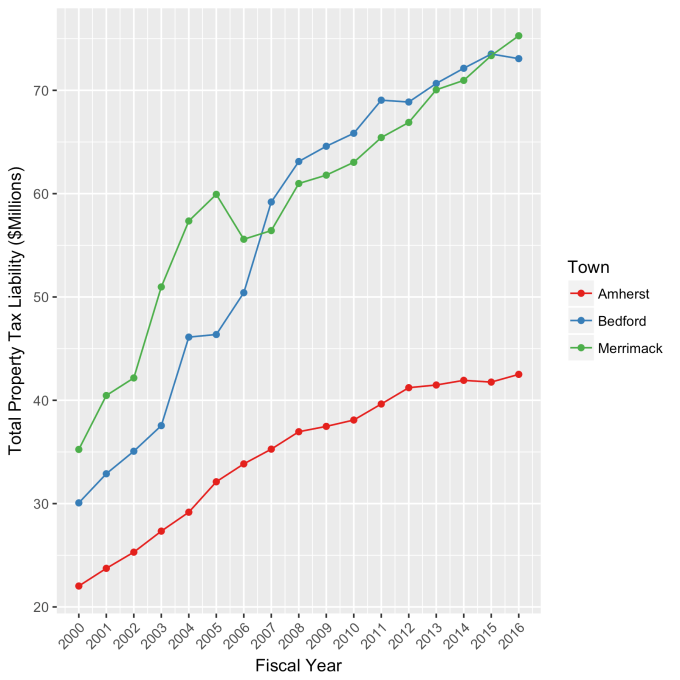
First, total property taxes for Amherst, Bedford, and Merrimack from 2000 to 2016. These are actual dollars.
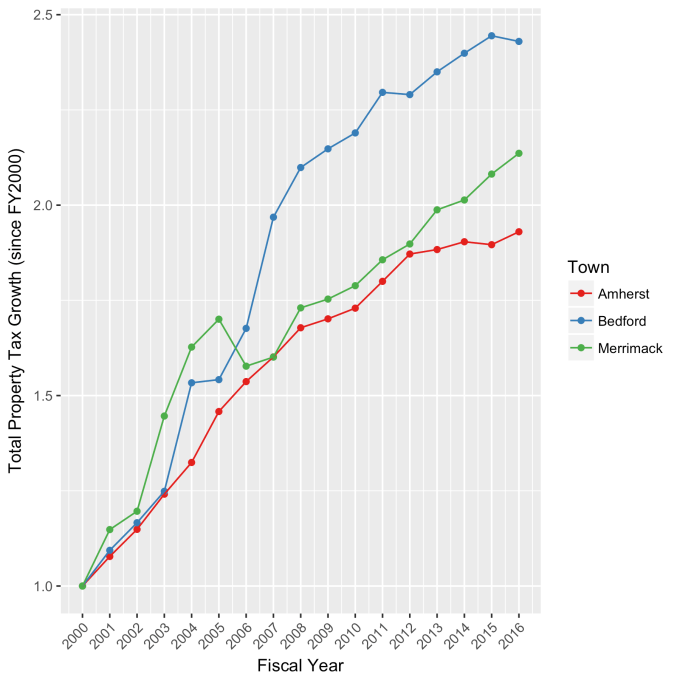
Let’s examine the fractional growth in the budget from 2000. This makes it easier to compare growth figures. Not quite double in 16 years for us.
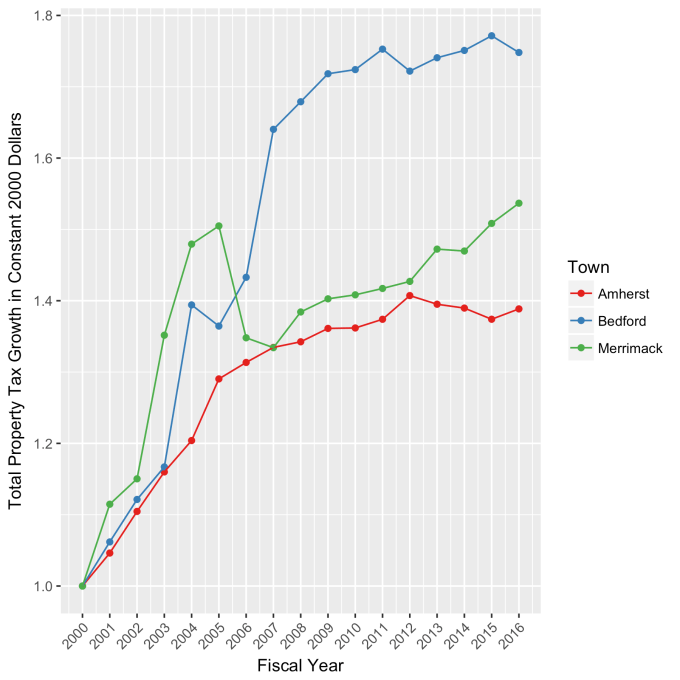
Same thing, but in constant 2000 dollars.
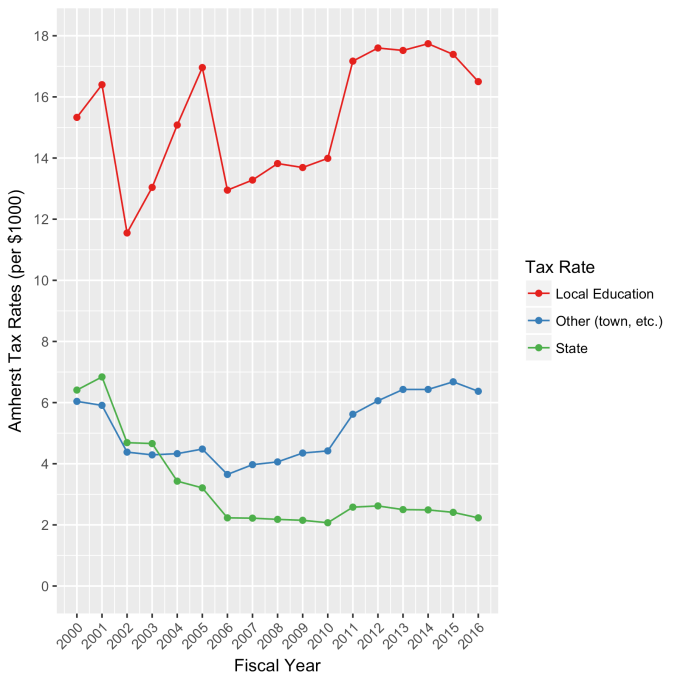
Here’s how Amherst property tax rates break down. The fluctuations mean less because the total property value of the town (Net Assessed Value) changes over time (see last graph). But this is how the mil rates compare over time.
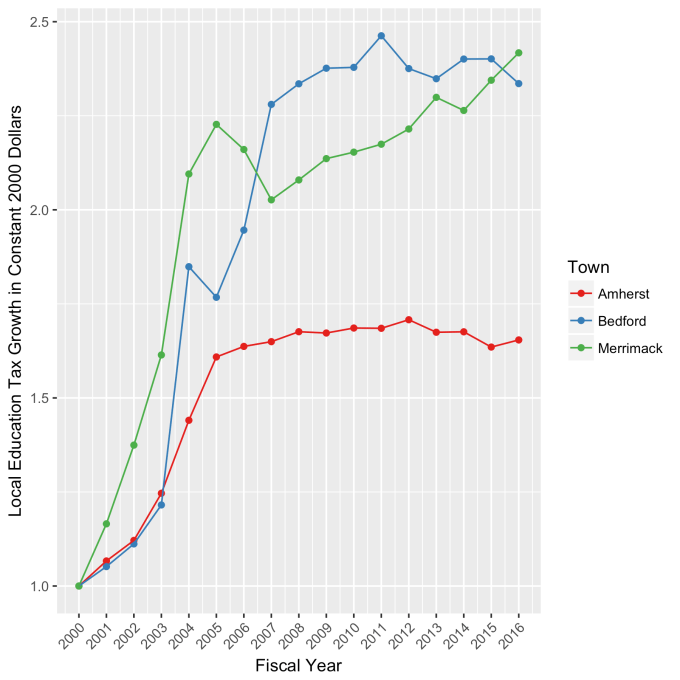
Since education makes up most of it, let’s just extract that number for Amherst, Bedford, and Merrimack. This is the local education tax liability.

Here’s the growth chart (plotted is the multiplier).

And in constant 2000 dollars. This basically says we in Amherst have had flat education spending (changing pretty much with inflation only) since 2005.
The Net Assessed Value (total taxable property value) for all three towns.

