One of the questions I was asked after yesterday’s post on property tax growth was on how inflation factors into the picture. My original intent was to measure the actual change in property tax bills, but it is instructive to add the inflation perspective. There are a handful of inflation rate calculators available online that will let you make adjustments for constant dollars. Since my property tax information starts in FY 2001, I’ll use constant 2001 dollars here.
Inflation essentially measures the change in buying power of a currency over time. That is, if something cost $1 in 2001, because of inflation it will cost a few cents more in 2002, and so on. You’re probably already made the observation that things cost more at the store, this is generally due to inflation. How it impacts you depends on whether your income has kept pace with inflation or not. The easiest way to look at this is to put together a table of multipliers for each year, referenced to 2001 (graphed below). This will allow us to recalculate the tax data from yesterday in terms of constant 2001 dollars.

Inflation multipliers to determine constant 2001 dollars in US currency.
The overall effect of taking inflation into account, particularly when it is increasing as we see above, is to shrink the value of the dollars being spent in time. What it allows us to see is whether the changes in the numbers come from changes in the value of the dollar, or whether actual spending has changed. Given what we know about health insurance costs in our school district, we should not be surprised to see that actual spending increases here.
Last time I broke out the education dollars for the towns that were raised by local property taxes and we looked at how they changed over time. Below is that information replotted in constant 2001 dollars. Amherst has a growth factor of about 1.7, Bedford hits 2.4, and Merrimack 2.2.

Locally raised education spending by town in constant 2001 dollars.
Likewise, here is the total property tax growth of the towns in constant 2001 dollars. Again, very similar to yesterday’s plot. Amherst comes in at a real growth factor of just under 1.4, Bedford at 1.7, and Merrimack at just over 1.4.
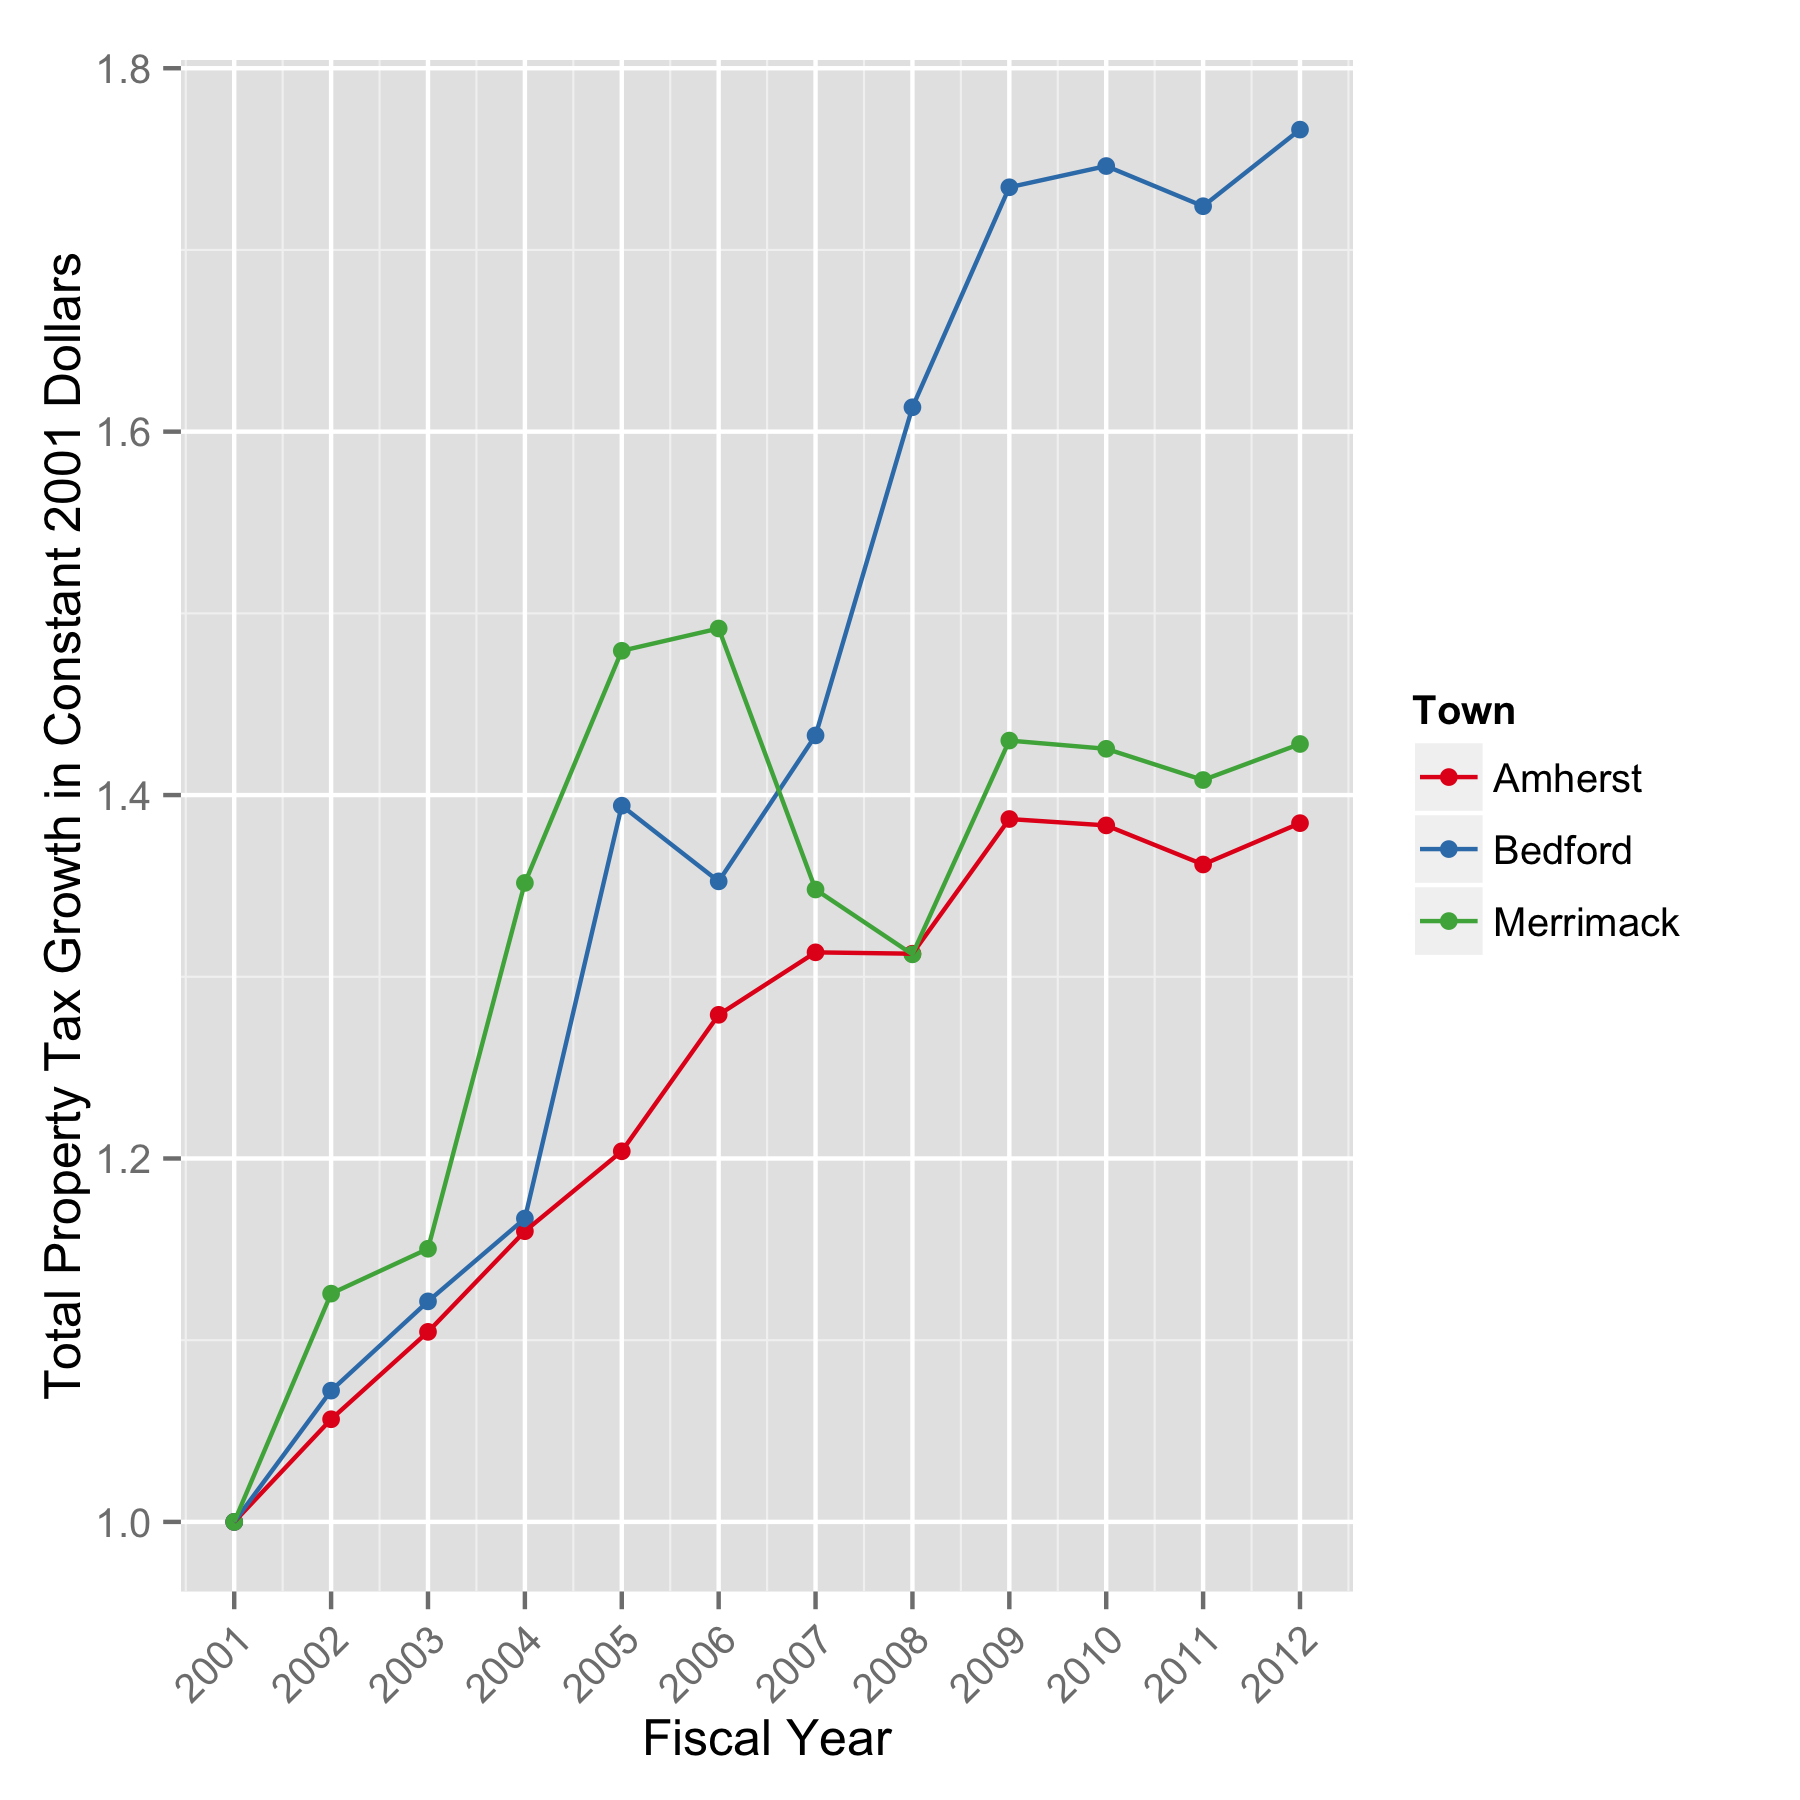
Changes in the total property tax burdens of Amherst, Bedford, and Merrimack in constant 2001 dollars.

One thought on “Amherst Property Taxes and Inflation”