Update on Amherst Property Taxes (2018)

Some years ago I was involved in budget evaluation for one of the town’s school districts.  I was asked to extend a budget analysis I did back then to include recent data.  I’d take it back farther, but I don’t have older data.

First thing first.  Data comes from the numbers reported by the state.  Scroll down to “Valuations, Property Tax Assessments, and School Tax Rates.”  I made one tiny change when updating this set of data in that previously I called 2000-2001 data FY2001 while I recognized that the state just indicates it to be from 2000.  So the dates are back shifted by 1 year in these updates to be consistent with how the state reported the numbers.  Constant dollar calculations come from Consumer Price Index data from the US Bureau of Labor Statistics.

First, total property taxes for Amherst, Bedford, and Merrimack from 2000 to 2016.  These are actual dollars.

Local Property Tax Liability (2000-2016)

Let’s examine the fractional growth in the budget from 2000.  This makes it easier to compare growth figures.  Not quite double in 16 years for us.

Total Property Tax Growth (2000-2016)

Same thing, but in constant 2000 dollars.

Total Property Tax Growth Constant Dollars (2000-2016)

Here’s how Amherst property tax rates break down.  The fluctuations mean less because the total property value of the town (Net Assessed Value) changes over time (see last graph).  But this is how the mil rates compare over time.

Amherst Property Tax Mil Rates (2000-2016).png

Since education makes up most of it, let’s just extract that number for Amherst, Bedford, and Merrimack.  This is the local education tax liability.

Local Education Tax Liability (2000-2016).png

Here’s the growth chart (plotted is the multiplier).

Local Education Tax Growth (2000-2016).png

And in constant 2000 dollars.  This basically says we in Amherst have had flat education spending (changing pretty much with inflation only) since 2005.

Local Education Tax Growth Constant Dollars (2000-2016).png

The Net Assessed Value (total taxable property value) for all three towns.

Net Assessed Property Value(2000-2016).png


Advertisement

Clarifications on Amherst School District Spending

A few months ago, as part of my school district budget analysis, I published some numbers on Amherst’s cost per student spending.  This cost per student number is a commonly used metric to understand spending efficiency as well as to draw comparisons between districts.  As this year’s Ways and Means committee chair for the district, I sought answers to the reasons behind the significant jump in this number.  On October 8th, Ways and Means met with members of the School Board and the SAU to discuss these, and other numbers dealing with our school district spending.

I really need to applaud the transparency of the school administration here.  Significant time and effort was put into their response to the questions I posed, and they worked very hard to provide real meaningful answers, and the numbers to back them up.  To the point of contacting other districts to clarify their numbers, and sometimes being told to go away.

A few interesting things came out of the discussion.  In reviewing our numbers and comparing them with other districts, it quickly became clear that making comparisons between districts is difficult because different districts will report numbers differently to the state, and that the state’s formulas for some derived metrics (i.e. cost per student) can omit some very important considerations that aren’t immediately apparent, but have some huge implications in the numbers that are the most visible to taxpayers.

Most importantly, in the state’s calculations, bond payments are not factored into the cost per student number.  This is huge.  Some districts with newer buildings (Bedford, for example) have some very significant (millions of dollars) costs to the taxpayer in their budgets, but these costs are subtracted before computing their cost per student, making the latter not as representative for comparison as you might imagine.    In FY 2012 Amherst had about $600k in debt service payments.  Bedford had $4.6 million, and Merrimack had $1.9 million.  So it would seem that if we want to draw more meaningful comparisons in spending per student, that we should take the actual bottom line budget and divide by the total enrollment.

I’ll take a second to point out that the growth of our education taxes for all education spending in Amherst (not just Amherst School District) has increased much more slowly than our neighboring towns, which I showed before.  That is to say, yes your school tax bill has gone up, but considerably more slowly than if you were in some of our neighboring towns.

Growth in the total locally raised education spending, referenced to FY 2011 for Amherst, Bedford, and Merrimack.

Growth in the total locally raised education spending, referenced to FY 2011 for Amherst, Bedford, and Merrimack.

Before I get to our spending per student numbers, I want to quickly touch on the special education spending issue that I had raised earlier this year.  Previously I pointed out the differences in the fractions of our budgets that Amherst, Bedford, and Merrimack spend on special education.  Now you might think that by comparing line item to line item in the various district budgets, that the numbers would be directly comparable.  I certainly did.  They aren’t.  Here’s the difference.  Amherst includes benefits in their special education budget section.  Bedford and Merrimack don’t.  So when we take benefits out of our special education budget, we get the following numbers which we can compare, and they paint a very different picture than before.

District Special Education % of Budget (without benefits)
Amherst 11.2
Bedford 15.7
Merrimack 15.1

Now, to get to our spike in per-student elementary education spending back in FY 2011.  The one where we jumped to $4533 over the state average in a year.  In that year we saw our elementary school enrollment drop from 710 to 629.  That’s 81 students, or an 11.4% drop.  Inconveniently, they didn’t all fall out of the same grade, so this has made it somewhat difficult to make rapid adjustments to staffing.  But we have been making staffing adjustments.  We just can’t make them as fast as the enrollment has changed.

And yes, this will hit the middle school shortly, but we are making adjustments.  Draft 1 of next year’s budget will be presented at next month’s school board meeting and we should know more then.

Amherst Property Taxes and Inflation

One of the questions I was asked after yesterday’s post on property tax growth was on how inflation factors into the picture.  My original intent was to measure the actual change in property tax bills, but it is instructive to add the inflation perspective.  There are a handful of inflation rate calculators available online that will let you make adjustments for constant dollars.  Since my property tax information starts in FY 2001, I’ll use constant 2001 dollars here.

Inflation essentially measures the change in buying power of a currency over time.  That is, if something cost $1 in 2001, because of inflation it will cost a few cents more in 2002, and so on.  You’re probably already made the observation that things cost more at the store, this is generally due to inflation.  How it impacts you depends on whether your income has kept pace with inflation or not.  The easiest way to look at this is to put together a table of multipliers for each year, referenced to 2001 (graphed below).  This will allow us to recalculate the tax data from yesterday in terms of constant 2001 dollars.

Inflation multipliers to determine constant 2001 dollars in US currency.

Inflation multipliers to determine constant 2001 dollars in US currency.

The overall effect of taking inflation into account, particularly when it is increasing as we see above, is to shrink the value of the dollars being spent in time.  What it allows us to see is whether the changes in the numbers come from changes in the value of the dollar, or whether actual spending has changed.  Given what we know about health insurance costs in our school district, we should not be surprised to see that actual spending increases here.

Last time I broke out the education dollars for the towns that were raised by local property taxes and we looked at how they changed over time.  Below is that information replotted in constant 2001 dollars.  Amherst has a growth factor of about 1.7, Bedford hits 2.4, and Merrimack 2.2.

Locally raised education spending by town in constant 2001 dollars.

Locally raised education spending by town in constant 2001 dollars.

Likewise, here is the total property tax growth of the towns in constant 2001 dollars.  Again, very similar to yesterday’s plot.  Amherst comes in at a real growth factor of just under 1.4, Bedford at 1.7, and Merrimack at just over 1.4.

Changes in the total property tax burdens of Amherst, Bedford, and Merrimack in constant 2001 dollars.

Changes in the total property tax burdens of Amherst, Bedford, and Merrimack in constant 2001 dollars.

Amherst Property Tax Review

One of the issues that I hear often in talking with people in town is about how much our taxes in Amherst have gone up in recent years.  So it made sense to me to dig deeper into this issue to better understand what has been taking place and put some numbers on it.

Lucky enough, the information that we’re after is collected by the state and made available online.  The tax rate graph for Amherst below shows that the largest property tax impact in our town budget comes from the cost of operating our schools.  This is not uncommon in New Hampshire where we’re largely on the hook for costs of what we do in our towns.  Since they are the biggest piece of the tax pie and since I’m chairing the Ways and Means committee for the Amherst School District this year, let’s start with education taxes.

Amherst tax rates by fiscal year.

Amherst tax rates by fiscal year.

Before we get too far into what these numbers mean, I think it makes sense to put our numbers in perspective, so I gathered information for Bedford and Merrimack as well as for Amherst.  Interestingly, the state does not split the Amherst School District and Amherst’s share of the Souhegan Cooperative School District apart, so the Amherst numbers that we will go over here are our complete numbers for the town’s education costs.

So let’s start by looking at local education property tax rates.  Below are the mil rates (tax rate per $1000 of property valuation) for education in the three towns since fiscal year 2001.  Note that the rates jump all over the place, particularly for Amherst.  This requires some explanation.

LocalTaxRates

Local tax rates for Amherst, Bedford, and Merrimack.

There’s a very good, but slightly odd, reason for these jumpy numbers.  This tax rate is calculated by first determining the amount of money that needs to be raised from the budget and then dividing that number into the total value of taxable property in town.  Take away a factor of 1000 and you get your mil rate.  Now every few years the town pays for an assessment of property in the town.  Either the people who do the assessments have some interesting formulas or the towns do a very poor job of estimating property values between valuations, because we see some pretty big jumps in the total value of taxable property in town.  Whenever you see a big change in valuation, the tax rate changes in the opposite direction (that is, when they consider that your house is much more valuable than it was the year before, your tax rate goes down, and vice versa).

The graph below shows the total assessed value of taxable property in each town by fiscal year.   I find it somewhat odd that property has increased in assessed value in spite of the real estate market downturn, but this doesn’t really affect your taxes, only the tax rate you pay, which as you saw above, is constantly adjusted to raise exactly the budgeted funds.

NAV

Total property assessment by year for Amherst, Bedford, and Merrimack.

Now “budgeted funds” is the key term here, and combining the information in two graphs above lets us come up with the total amount of property tax money each town raises to cover their local education budgets.  And this is the information that we need to understand how people’s actual local tax bills are changing over time.   Remember that the amount raised by property taxes is the number that is left over after subtracting any state and/or federal money from the school budgets that we vote on in March.  I have graphed these numbers below for clarity.  When it comes to Bedford’s numbers, it can be useful to recall that they opened their new high school in 2007.

LocalEducationRevenues

Taxpayer raised local education dollars for Amherst, Bedford, and Merrimack.

With all this in mind, we now can calculate, on average, how much our education property taxes have gone up with respect to FY 2001 numbers.  For Amherst, the answer is they have increased, on average, by a factor of 2.2 (as of FY 2012), and we are the lowest of the three towns.  The graph below has the details.

ActualTaxRateGrowth

Growth in the total locally raised education spending, referenced to FY 2011 for Amherst, Bedford, and Milford.

While this shows the bulk of the spending in each town, it doesn’t tell the whole tax burden story.  What about everything else included in property taxes?  It is easiest to just look at the total tax burden.  We don’t really need to look at the rates, since a decrease in the rate doesn’t necessarily mean a decrease in spending.  So below is the total property tax burden for each town, which includes the local education numbers from above, but also the state property taxes, and other town and county spending for Amherst, Bedford, and Merrimack.

TotalTaxLiability

Total tax liability for Amherst, Bedford, and Merrimack.

To put numbers on growth, we can normalize these to 2001 as we did before with the education budgets.  It is interesting to see that Merrimack’s growth is reasonably close to ours, with a few years of exceptions.  Compared to the other towns, Amherst looks fiscally responsible.

TotalTaxGrowth

Growth in the total tax liability for Amherst, Bedford, and Merrimack.

So now we have the answer that we set out to find.  Although our actual school tax rates have more than doubled, our total tax burden in Amherst has, on average, increased by a slightly smaller factor of about 1.8 since FY2001.  Note that this is averaged over the whole town and how this impacts your household tax bill has much to do with how your property’s valuation has changed compared to the rest of the town.

Budget Review Slides Submitted to Administration and School Board

With all the work I’ve done to better understand how and where we spend money in Amherst School District, it was time to do something with it and press for some changes.  My intention is to refocus the budgeting process before it happens, rather than respond to it once it comes out.  I’m hoping the proactive approach is the more effective one. That in mind, I summarized my budget evaluation (which I’ve done in bits and pieces here) and questions/recommendations in some slides and met on Wednesday (7/17/13) with the Superintendent (Peter Warburton), the Business Administrator (Betty Shankel), and the ASD School Board Chair (Peg Bennett) to review them.

It was a good meeting, the contents were well received, and once they have fully digested them, we will meet again with a larger group to review them and their responses to the questions and recommendations. I think I got my point across that I was there for a cooperative meeting and that I wanted to drive the discussion on where W&M sees issues that need to be addressed earlier in the process than has been typical.  We are supposed to be the check/balance in this process and the points made were, I think, well received (we were encouraged to push them on spending issues).  I openly invited them to suggest other metrics to judge value if they feel I have selected incorrect ones (mostly because last year’s W&M committee meetings did not produce any metrics I was looking for).  And in general, that if they feel that the numbers for certain spending areas are justified (special education and teaching coaches come to mind)  in how they deviate from state averages or other town numbers, that the case needs to be made for them.

These are the slides.  I talked over them quite a bit in the meeting, but hopefully the messages are clear.

Amherst School District – Per-Student Spending and Special Education Budget Comparison

Recently I was preparing some charts to go over at the beginning of this year’s Amherst School District Ways and Means budget meetings.  I’ve gone through our budgets quite extensively trying to understand what our costs are and how we can control them.  One thing I look at is per-student spending, which we’ve gone over before.  What I really wanted to understand is how we compare with some of our neighboring towns.

Luckily, the state Department of Education puts their numbers online.  The state does the calculation somewhat different than you might expect as they remove certain budget areas like transportation and food service from the calculation.  With that in mind, these are the state’s cost per student numbers for elementary school education in Amherst, Bedford, Merrimack, and the state average as reported by the NH DOE from 2001-2012.

Per Student Costs by Fiscal Year For Amherst, Bedford, Merrimack, and the State Averages, by Fiscal Year.

Per Student Costs for Elementary Education by Fiscal Year For Amherst, Bedford, Merrimack, and the State Averages.

So according to the state, in FY 2012 we outspent the state average by $4533/student, Bedford by $6378/student, and Merrimack by $4745 in elementary school education.  Go back and read that again.  I found this to be remarkable.  And a little surprising.  We need to understand why Amherst’s numbers are so very different from our neighboring towns.  Those other New Hampshire towns have the same health insurance and NH Teachers Retirement fund constraints that we do, so those probably aren’t the drivers.

For the record, here are the middle school numbers.  We’re high there too.

Per Student Costs (Middle School) by Fiscal Year For Amherst, Bedford, Merrimack, and the State Averages, by Fiscal Year.

Per Student Costs for Middle School by Fiscal Year For Amherst, Bedford, Merrimack, and the State Averages, by Fiscal Year.

The table below has these cost/student numbers for just FY2012, and includes the numbers for the total district.  Keep in mind that Bedford and Merrimack don’t have multiple districts in their towns like we do, so their district numbers include high school (for the record, our Souhegan HS district comes in at $18,456.28/student in FY2012 according to the state).

Elementary Middle School District
Amherst $17,946.34 $15,536.66 $16,569.40
Bedford $11,567.85 $11,855.69 $11,385.20
Merrimack $13,201.02 $13,521.11 $13,157.54
State Average $13,413.70 $12,605.50 $13,159.15

I was pleasantly surprised to find that both Bedford and Merrimack school districts have their FY14 school budgets available online.  I have not yet done a thorough analysis to see how they compare with things we’ve already looked at, like health insurance.  But to try to understand how they spend so much less per student than we do, I took a quick look at their education spending and found something remarkable.  Amherst School District’s budget is heavily weighted in Special Education.  Considerably more than neighboring towns.  Here are the numbers, including the percentage of the budget spent on Special Education.

School FY14 Total Budget FY14 Special Education Budget % Special Education
Amherst $24,278,572.00 $5,073,488.00 20.9%
Bedford $62,660,875.00 $9,882,992 15.7%
Merrimack $67,291,503.00 $10,171,841.00 15.1%

Now these are telling numbers.  In Amherst we are spending between 4 and 5 percentage points more of our budget on Special Education than our neighboring towns. This is a lot of money.  Why these numbers are so different needs to be understood.

Now what would our budget and cost/student look like if we had the the Special Education budget percentages of Merrimack or Bedford this upcoming school year?  I ran the numbers using Merrimack’s spending:

  SPED @ 20.9% SPED @ 15.1%  
Special Education: $5,073,488.00 $3,415,745.21  
Total Budget: $24,278,572.00 $22,620,829.21  
Cost/student: $17,984.13 $16,756.17  

That is to say, if our special education spending was in line with neighboring towns, we would shave about $1.5 million off of our bottom line budget and reducing our spending/student by around $1200.  What I take from this is that we are extravagant in several areas in Amherst School District, Special Education being only one of them.

Amherst School District – Value and Trends in Standardized Testing (Part 2)

Value is a word that we should probably use more when it comes to the school district.  We talked before about the black box approach to understanding complicated things.  We take something complex, like an electronic circuit or a whole school district, and put it into a big black box and simply look at what goes into it and what comes out of it, and use those to learn what it does without having to be too concerned with the details of how it all actually happens (for now, at least).  This is a great way of getting an overall look at how something behaves, and we can use it to look at its effectiveness, or value.

A useful way to think about value is to look at input/output ratios.  You do this all the time, even if you don’t realize it.  Into your car you put gas, out of your car comes miles of travel, divide the two and you get your miles/gallon ratio.  In this case, a higher number means greater value – more miles out of a gallon of gas is greater output for every unit of input and therefore more value.  We can use this same approach with our black box model of the school district.  Into our school district go money, students, and staff, and out come educated students.  The measure of the amount of education the students have is currently done, for better or for worse, with standardized tests, which is a reasonably good way to look at groups as a whole.

Previously we looked at NECAP test scores over time.  But the word value often refers to comparisons made with money – how much of something do we get for our dollar spent.  So lets look at one of the measurements of education that we can make, average NECAP scores and proficiency numbers, and compare them with the dollars it took to get those scores.  In order to do this we have to get rid of the silly NECAP convention of adding the grade level in the hundreds place of the scaled score, and just use the actual test score numbers which go from 0-80.  I don’t have budget numbers for all of the years that I have NECAP scores, so there are a few less years on these graphs than there were on the ones you saw with just NECAP results before.  And because we usually like to look at large numbers instead of lots of decimal points and zeroes all over the place, we will flip the ratio so that the output is on the bottom of the fraction.  This means that instead of points/dollar, we’re looking at dollars/point, and value goes up as the numbers go down.  With all of that in mind, here are the dollars per student-NECAP score numbers for Amherst School District from grades 3-8 for 2008-2012 in reading and math.  We get these by taking the $/student numbers and dividing them by the mean scores for each year.

Amherst School District spending per student  per NECAP test score for reading and math for grades 3-8.

Amherst School District spending per student per NECAP test score for reading and math for grades 3-8.

2009 was the year we had a one-time $2 million bump in the budget.  What we see here is that over time, in general, more dollars are required for every point scored in math and reading.  In other words, value is going down as the years go by.

We can look at these in a slightly different way.  Rather than the cost/point each year, we can look at the test scores and how much we spent per student in the teaching year.  It is the same idea as above, but now we don’t necessarily care which year it is, only what the spending per student number was that year.  Per-student total spending was gone over in a previous post if you want to look at those numbers and how we get them.

This look gives us a sort of price elasticity curve, if you’re familiar with economics.  That is, looking at the numbers this way we see how the amount of education changes as the cost of educating a student changes.  First the NECAP average scaled scores, grades 3-8, math and reading.

ASD NECAP Math and Reading score as a function of per student spending.

ASD NECAP Math and Reading score as a function of per student spending.

NECAP reading and math scores don’t seem to be very elastic. That is, they don’t change much regardless of how much money we spend.  What about the percentage of students who test proficient or above?

ASD NECAP student proficiency as a function of per student total spending.

ASD NECAP student proficiency as a function of per student total spending.

No matter how we look at the numbers, it is clear that the increases in spending haven’t given us any increase in educational value.

The key to understanding why this is so is to look at how the money was spent.  So we have to dig a little bit into the budget.

There is a good reason why the extra spending we do each year doesn’t give us a bump in education – it isn’t spent on education.  Since  2008, the average annual budget increase is $417k.  The average increase on insurance and NH Retirement is $395k.  That is, the spending increases each year go overwhelmingly into health insurance premiums and the NH Teachers Retirement fund.

Insurance and retirement costs for Amherst School District.  The major drivers here are health insurance and the contributions to the New Hampshire Retirement System for teachers.

Insurance and retirement costs for Amherst School District.

What this means to me is that the top priority this year is to get control over these costs.  I am certain that the school board and the administration have plenty of programs they would like to implement, but can’t because of budget constraints.  I know from talking with people in town that they want tax relief.  Making this happen will take creativity and leadership.  I have high hopes that we are up to the challenge.

Amherst School District Health Insurance and NH Retirement Costs

In my last post I made a reference to the growth in expenditures in the health insurance and New Hampshire Retirement fund contributions in the Amherst School District budgets, and how they are driving forces in increasing the  budget over the years.  I also said I would dig through the budgets and come up with these numbers.  This is a somewhat cumbersome task because the budget is organized into sections like “regular education” and “special education,” with a complete set of spending numbers for each section.   So a subject like health insurance appears in about 12 separate places throughout the 30 or so pages of the budget, and then there are separate lines for the different schools in the district.

So with the caveat that I went through PDFs of these budgets by hand and could have missed a line in the tallies (though I was quite careful in doing this), here are the annual budgets for the NH Retirement contributions for non-teachers (NH Ret (NT)), contributions for teachers (NH Ret (T)), health insurance, and dental insurance for Amherst School District from FY10 through the budget we just voted on in March (FY14).  Click it for a bigger version.

Insurance and retirement costs for Amherst School District.  The major drivers here are health insurance and the contributions to the New Hampshire Retirement System for teachers.

Insurance and NH Retirement fund costs for Amherst School District. The major drivers here are health insurance and the contributions to the New Hampshire Retirement System for teachers.  NT denotes contributions made for non-teachers (red).  T indicates contributions made for teachers (blue).

Since we have been reducing the levels of staffing in the district in response to the decrease in enrollment that I talked about in my previous post on the budget, we would hope to see these numbers decreasing.  However, this is not a trend that we can see here.  There are a few modest occasional decreases, but these are nowhere near offsetting the increases.  From FY13 to FY14, the NH Retirement fund contributions for (not from) teachers increases by 20% ($231,551) and health insurance by 4% ($135,393).  Those changes are more than either the dental insurance or non-teacher retirement entire budgets.

Now that we have seen how each category changes independently, let’s look at them combined so that we can see their total impact on the school budget each fiscal year.  This one also gets bigger with a click of the mouse.

Insurance and retirement costs for Amherst School District.  The major drivers here are health insurance and the contributions to the New Hampshire Retirement System for teachers.

Insurance and NH Retirement fund costs for Amherst School District. The major drivers here are health insurance and the contributions to the New Hampshire Retirement System for teachers.  NT denotes contributions made for non-teachers (red).  T indicates contributions made for teachers (blue).

This is impressive.  Now, we can see that these four spending areas combined have increased from $3.8 million to almost $5.5 million since FY2010.  They increase by an average of just over $395,000 per year, with almost 40% (~$150,000/year) of that average increase being the beyond-our-control NH Retirement fund contributions for teachers that the state downshifts to us (that is, more of the fraction they used to pay is now taken on by the town).  Health insurance costs increase by an average of about $244,000/year – or about 1% of our most recent ASD budget.  And both of those dollar increases are with staffing reductions in place.

Almost every person I know in town has complained about rising property taxes in Amherst, and the school budgets are the majority component of them.  If we seek to reduce this overall budget, or even hold it constant, then without implementing any new initiatives, either $400k of new cuts must be made in other areas annually to compensate or we will have to find some way to get these annual increases under control.  Frankly, I’d rather see us find ways to make our insurance more affordable than to have to cut more teachers.

So why are these numbers what they are?  What we were told last year on health insurance is that there are contractual obligations in place that obligate us to keep certain health insurance programs available.  And that the more expensive option (the JY Plan) has been removed.  Also that there are a very limited number of insurers in the state, which keeps competition down and prices high.

Those may all be true.  But we should not be entering into the sort of contracts that obligate us to carry unaffordable options in perpetuity.  And what other plan options have we considered?  I have seen companies drop HMOs for PPO plans with secondary insurance plans to cover deductibles in order to reduce costs without reducing benefits.  Has this been investigated?  Would a consolidated school district allow us to reduce our health insurance premiums by increasing our group size?  Have those numbers been run?  Not a bad starting set of questions.

Amherst School District Budget History

Last year I served my first term on the Ways and Means committee for the Amherst School District.  During budget season, the committee reviews a very complicated budget and scrutinizes it, submitting questions to the administration, meeting with various district employees responsible for budget areas, and reviewing spending plans for efficiency and value.

As I begin to prepare for budget season this year, I thought it would be a good exercise to review some information from previous budget years to understand how the budgets have changed.  This is important to understand as the Ways and Means committee is somewhat dynamic in its makeup.  That is, appointments are for three year terms, and so information has a way of quickly becoming lost as people cycle through their turns on the committee.  It makes sense to me to share this information publicly.

A little bit of background.  The district annually publishes a summary of its proposed budget and revenue assumptions.   This is its “MS-26” file, and they are published online on the district’s finance page for each fiscal year.  This document gives a very high level overview and breaks spending down into coarse categories.  Things like “regular programs,” and “special programs.”  These are the totals for all of the spending categories inside of the  regular and special education programs in the full budget, and they’re the two largest categories in the budget.

So let’s have a look at the six largest budget areas (in 2008) and see how they change over time.  These areas are regular education, special education, support, operation & maintenance, administration, and SAU management services.  The graph below shows these numbers, as taken from the MS-26 forms mentioned previously.  Now each year when these forms are published, they show the actual spending numbers from the previous fiscal year, the appropriated numbers in the current budget, and the requested numbers for the budget to be voted on.  The numbers in the graph below are actual numbers with the exception of the last two years, which fall into the “appropriated,” and “requested” categories.  Go ahead and click on it for a larger version.

Spending in Amherst School District for the top 5 categories (in FY08)

Spending in Amherst School District for the top 6 categories (in FY08)

Here are the individual categories shown separately each year.

Budet category spending in Amherst School District for the top 5 categories (in FY08)

Budet category spending in Amherst School District for the top 5 categories (in FY08)

It would seem that in 2009 much of the money that was previously in the “support” budget was shifted into “regular” and “special” education budgets, and so after 2008, support is a relatively minor budget area.  That would explain the large percentage changes in those education spending  budgets.  Other than that, these combined budget areas show an average total of a few hundred thousand dollars per year annual growth in spending, with single digit percentage changes in each budget per year.  There isn’t anything else huge that jumps out at me.

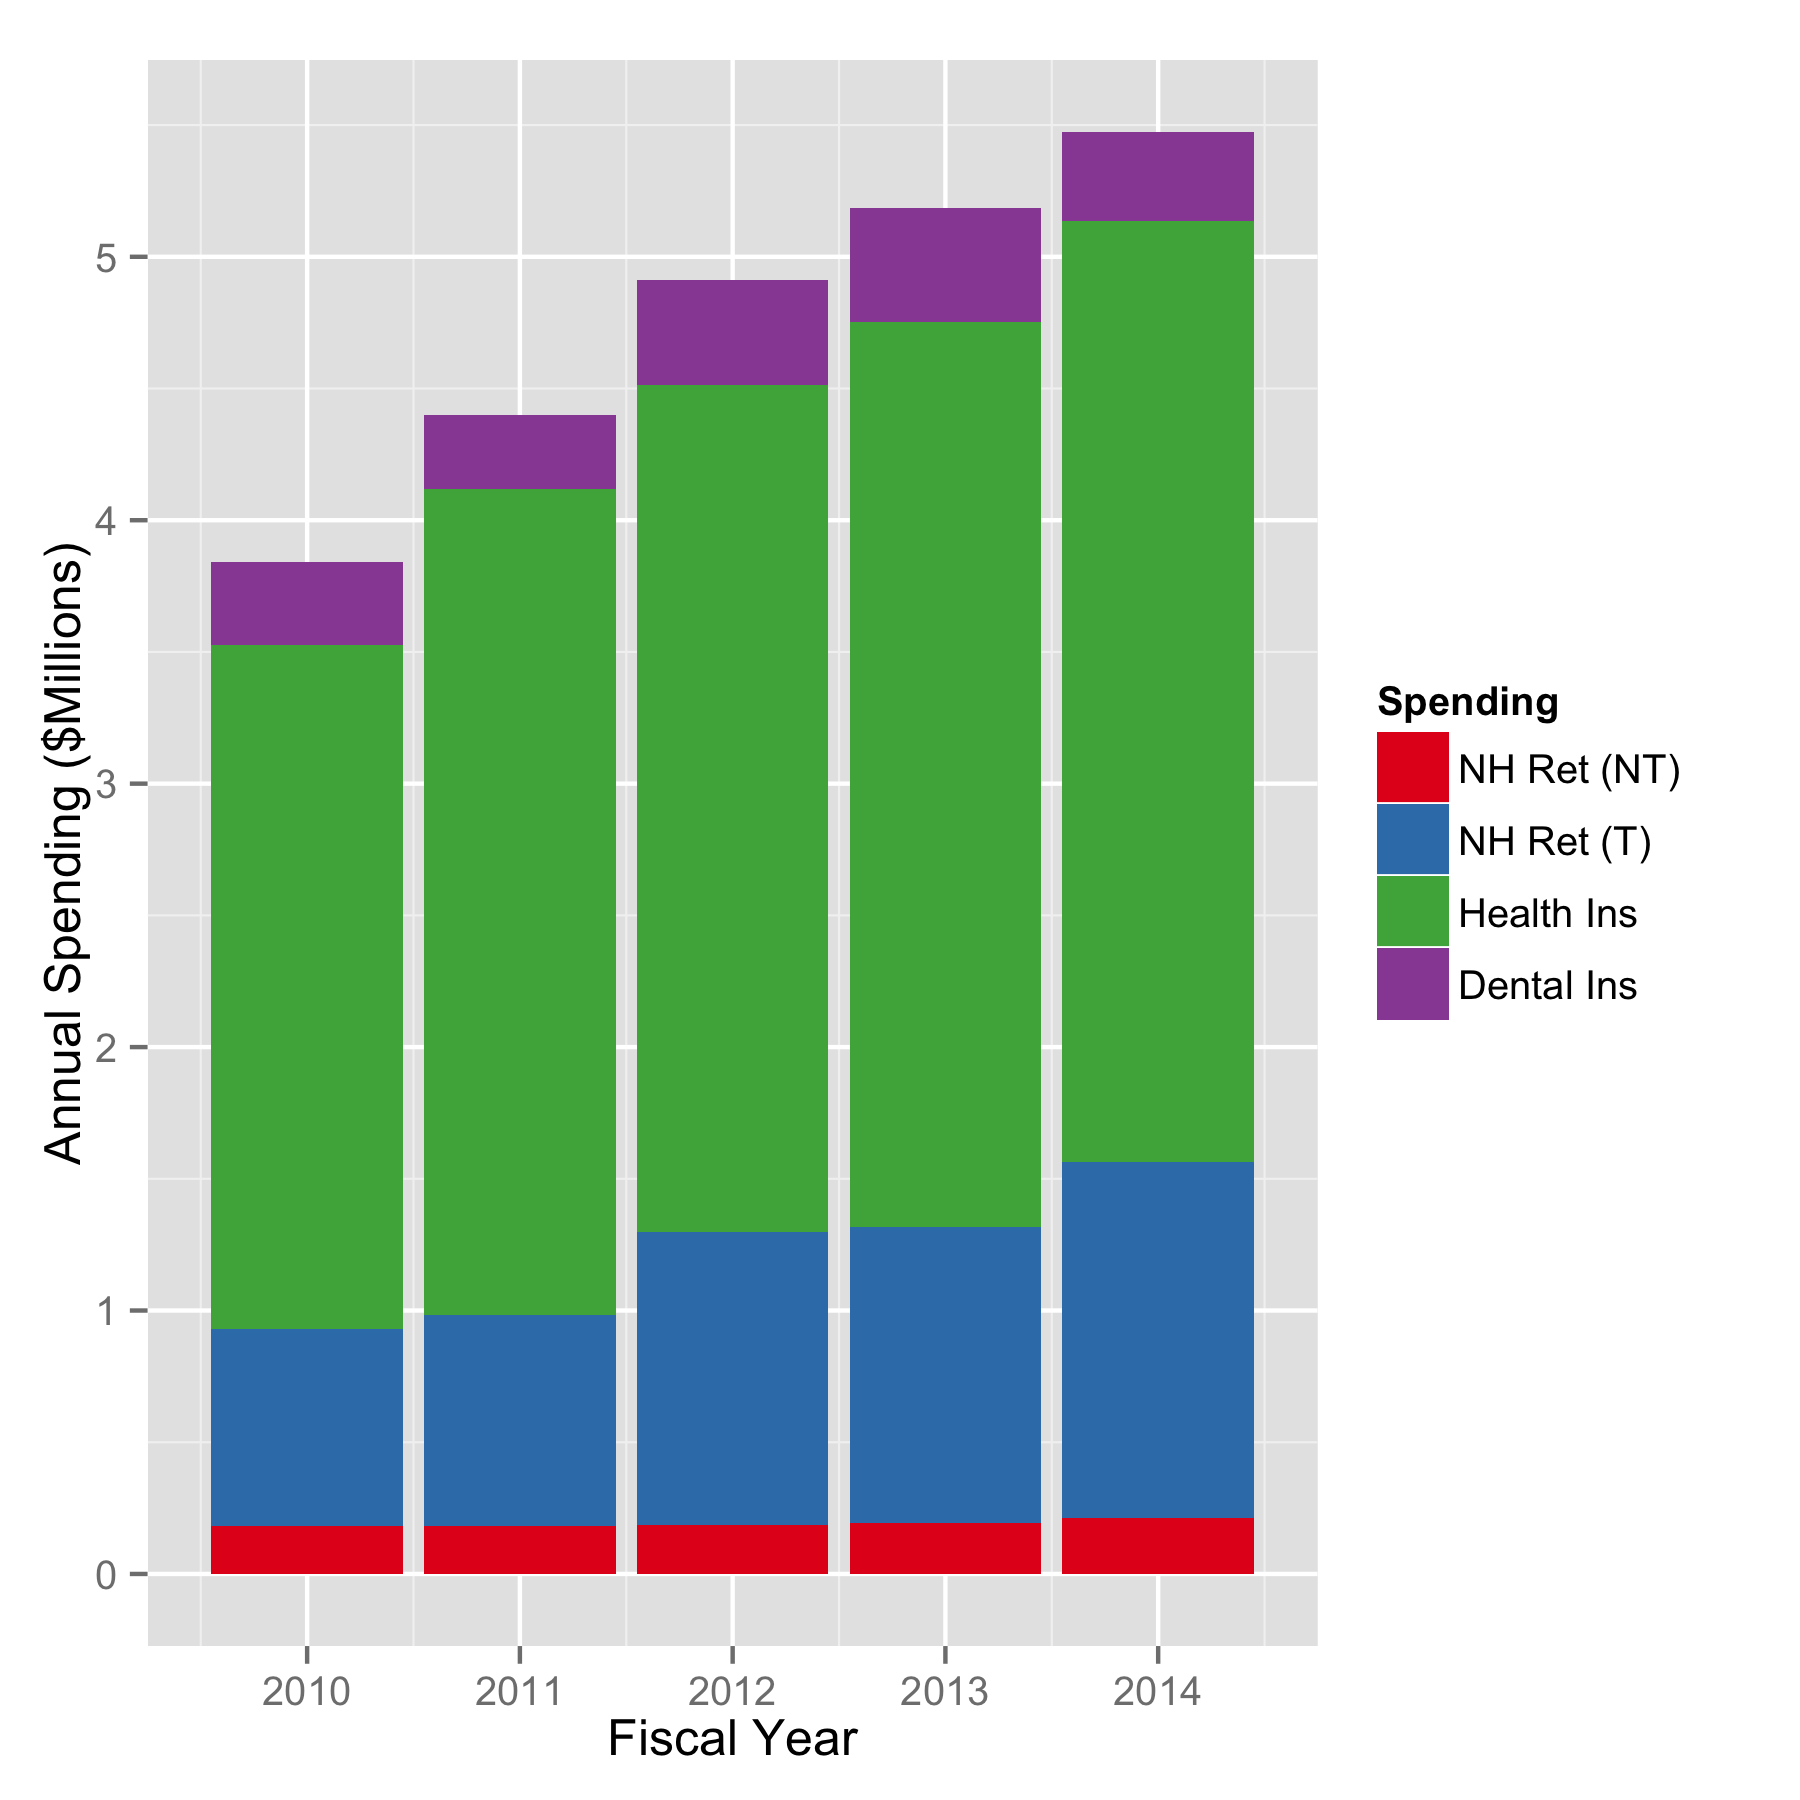
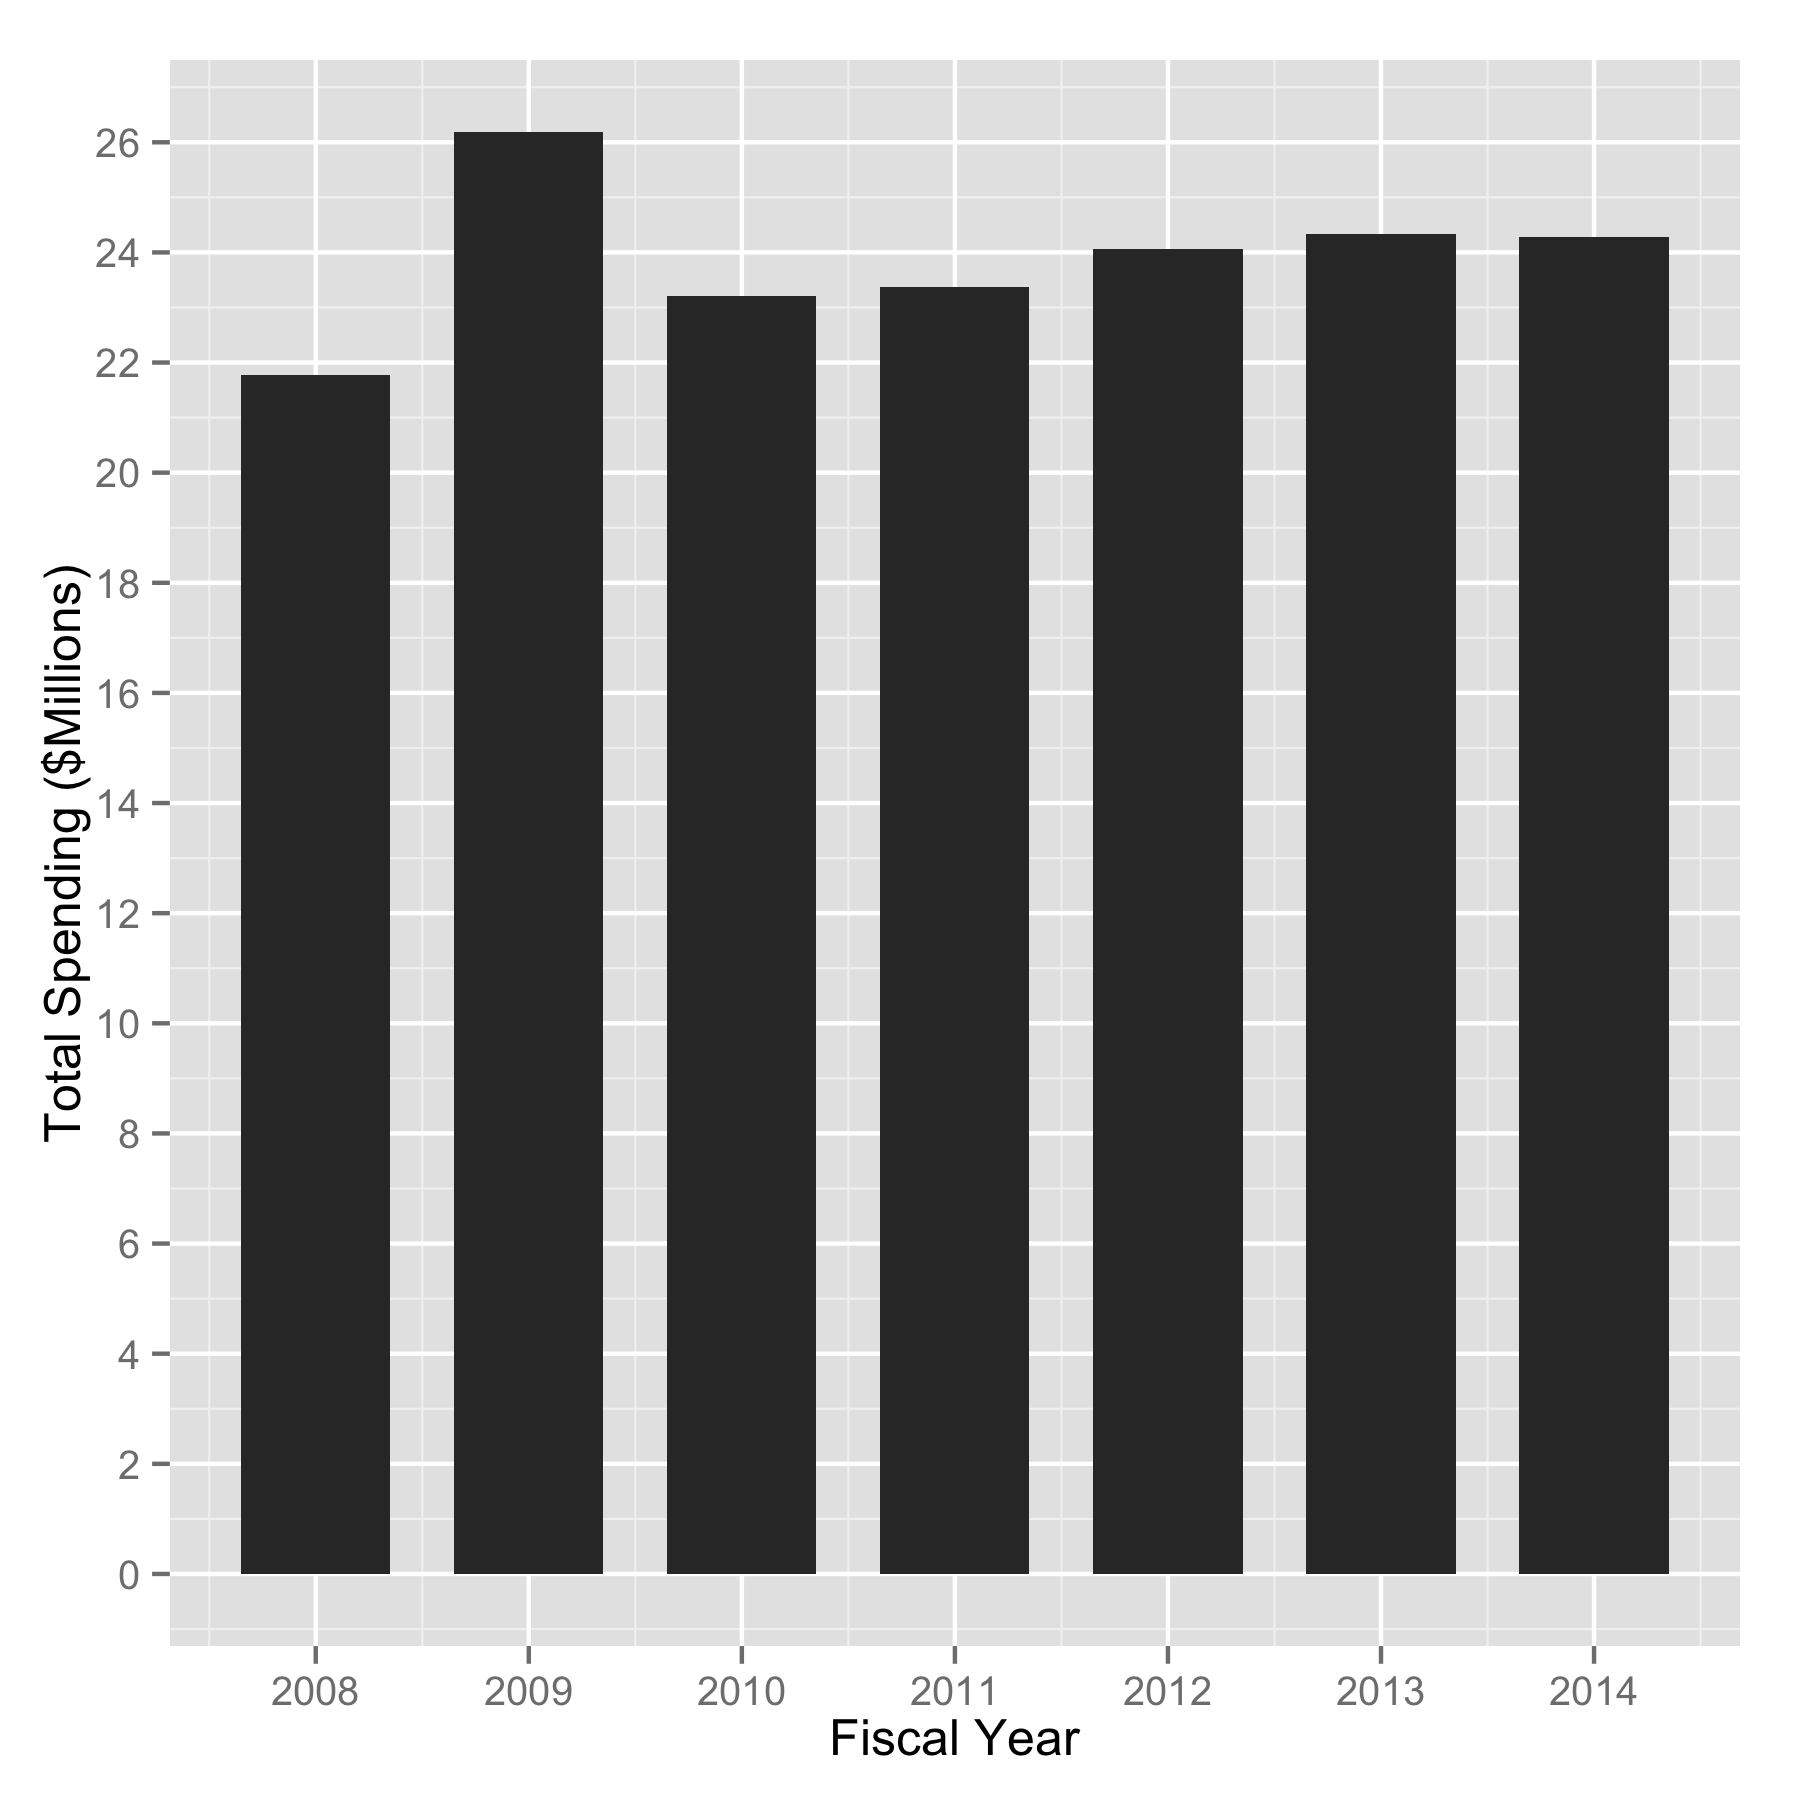
Total spending, seen below, increases at about the same rate, with the outlier being 2009.   I’m not sure what happened this year, but we spent a few million dollars more than the trend would otherwise lead you to expect.  Large contributions to the increases in total spending each year come from uncontrolled health insurance expenses (something I addressed during my campaign for school board last year, but I digress) and the state of NH’s downshifting teacher retirement expenses to the districts.  I plan to dig into these budgets to get these numbers (it isn’t as easy as you might think), but I don’t have that done yet.  (Note:  It is done now.)

Total spending numbers for Amherst School District since FY08.

Total spending numbers for Amherst School District since FY08.

So spending is one thing, but there’s something else we haven’t thought about yet.  When we think about something as complicated as a school district, it can be instructive to think about it as something simpler – a black box.  Into the box go things like students, staff, and money (all easy to quantify), and out of it comes something somewhat less easy to measure – education (a topic for another time).  This sort of simplification can let us more easily think about efficiency in terms of output as a function of input; efficiency being a word too infrequently used when we consider publicly funded enterprises.

We just looked at the money input, now let’s consider the student input.

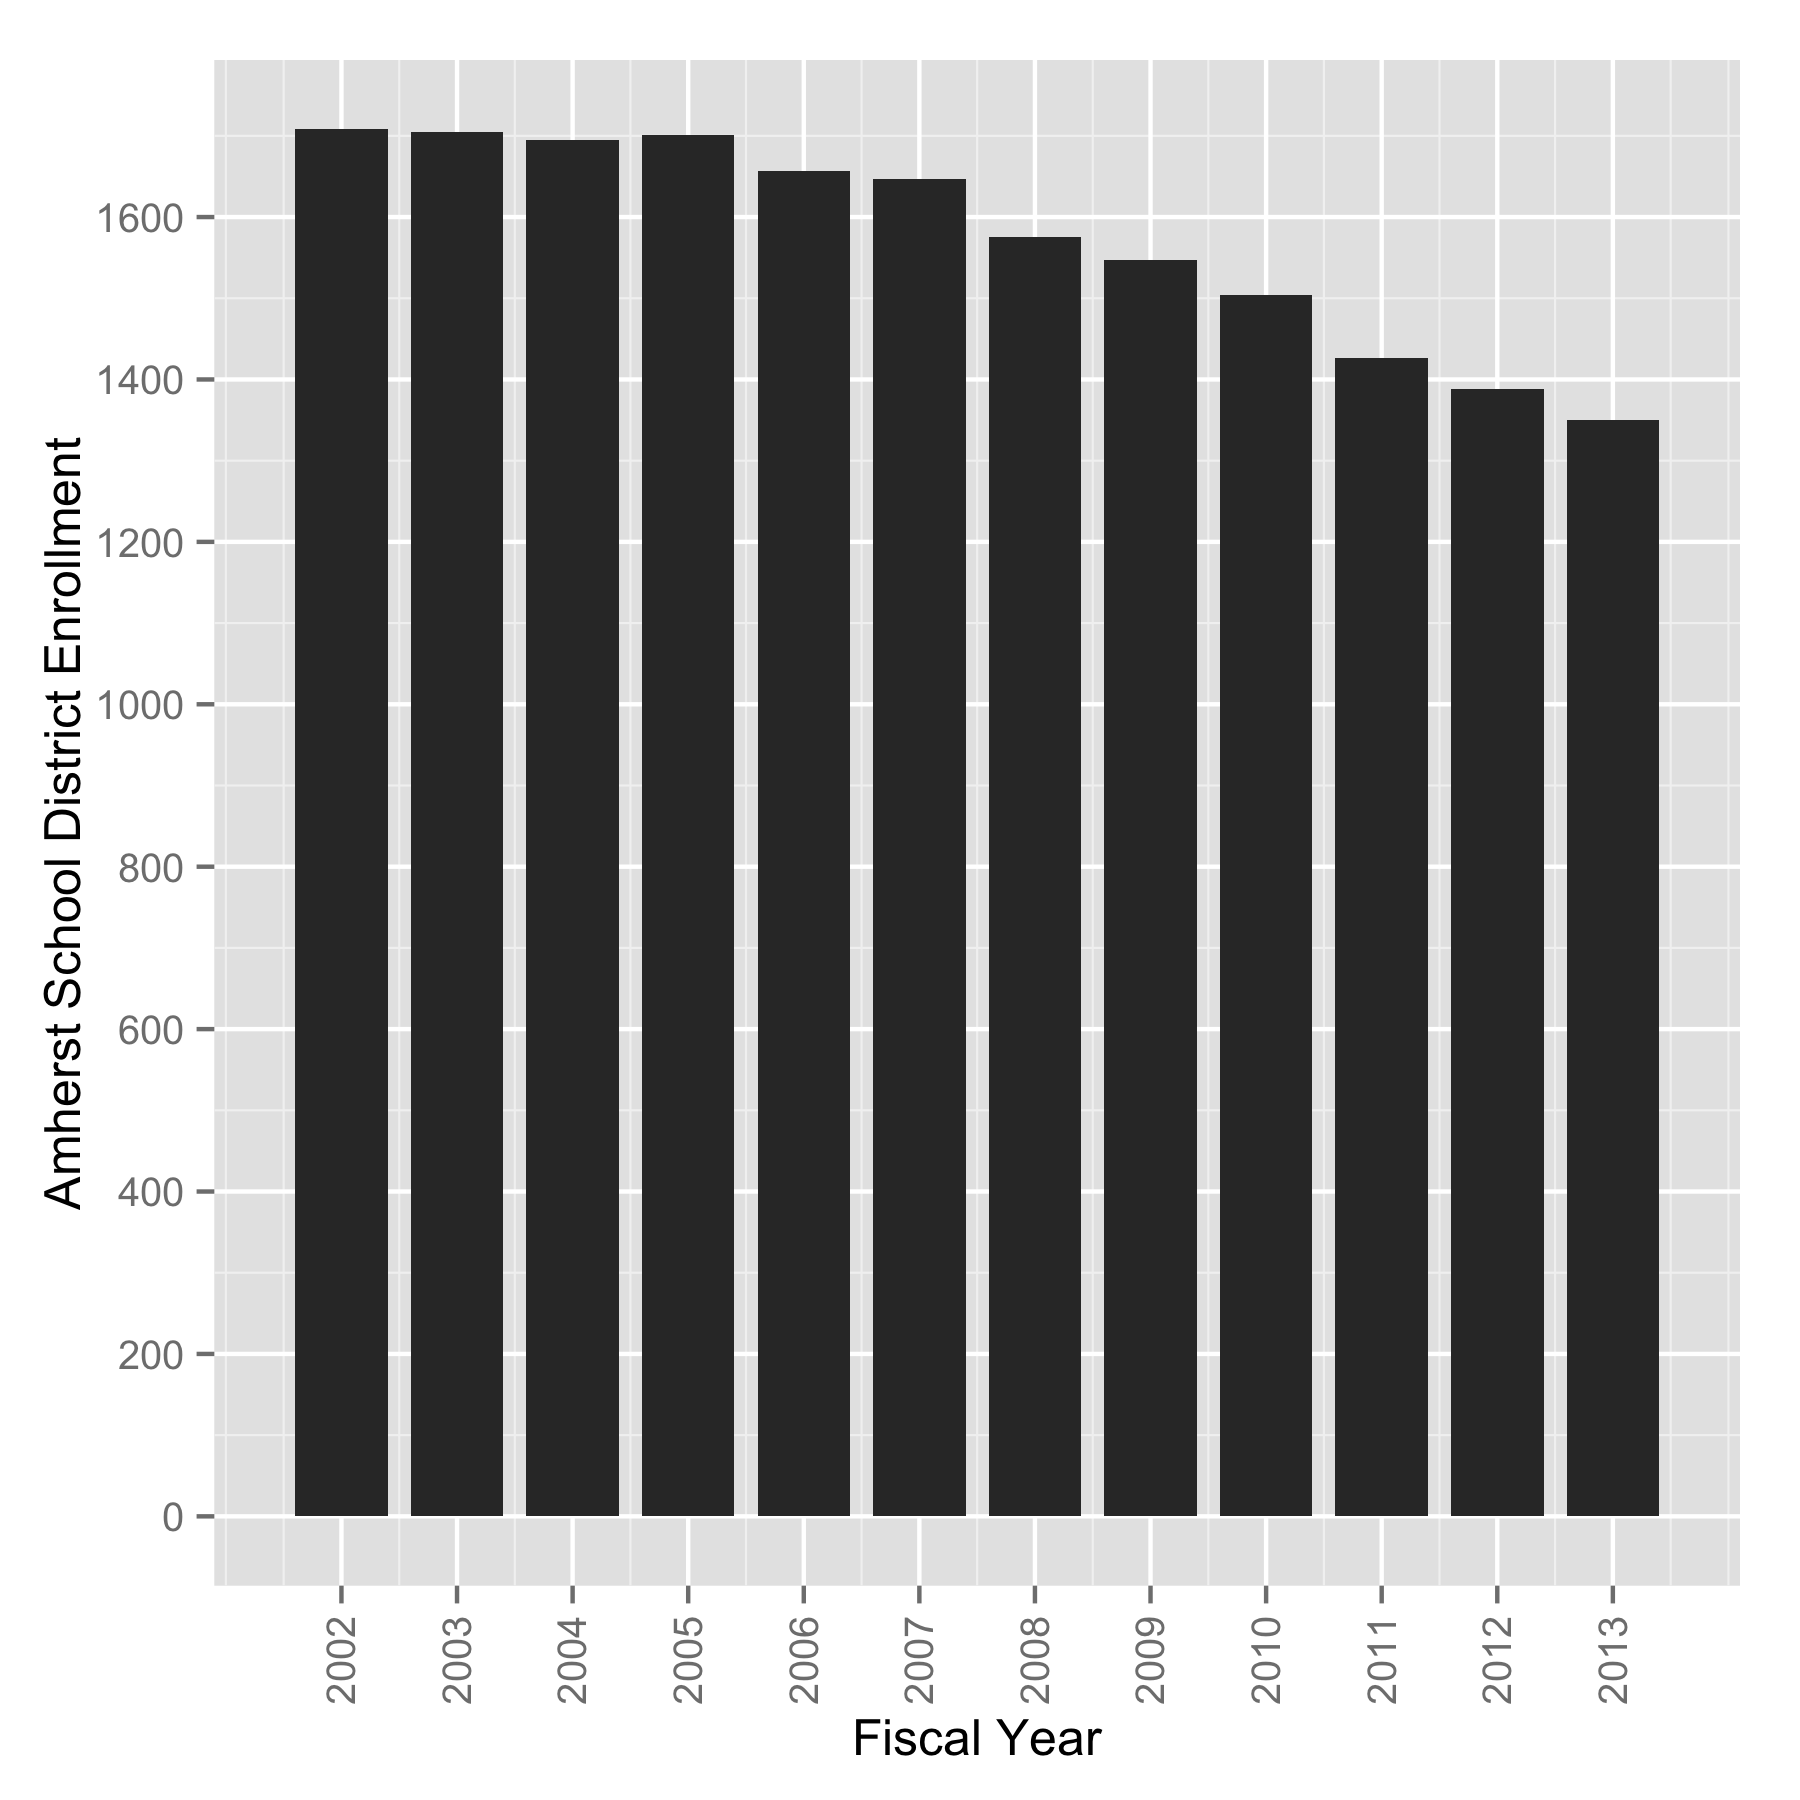
Below is a graph of the enrollment in the Amherst School District since 2002.  These numbers come from the New Hampshire Department of Education.  Notice that enrollment has dropped every single year since 2005.  Now go back and look at that spending graph above.  Sure, education spending has been relatively flat, but what does that mean when you have a decreasing enrollment?  This graph gets bigger with a click as well.  It is instructive to have a good look at it as it is what is happening in our schools right now.

Total enrollment at Amherst School District by fiscal year.

Total enrollment at Amherst School District by fiscal year.

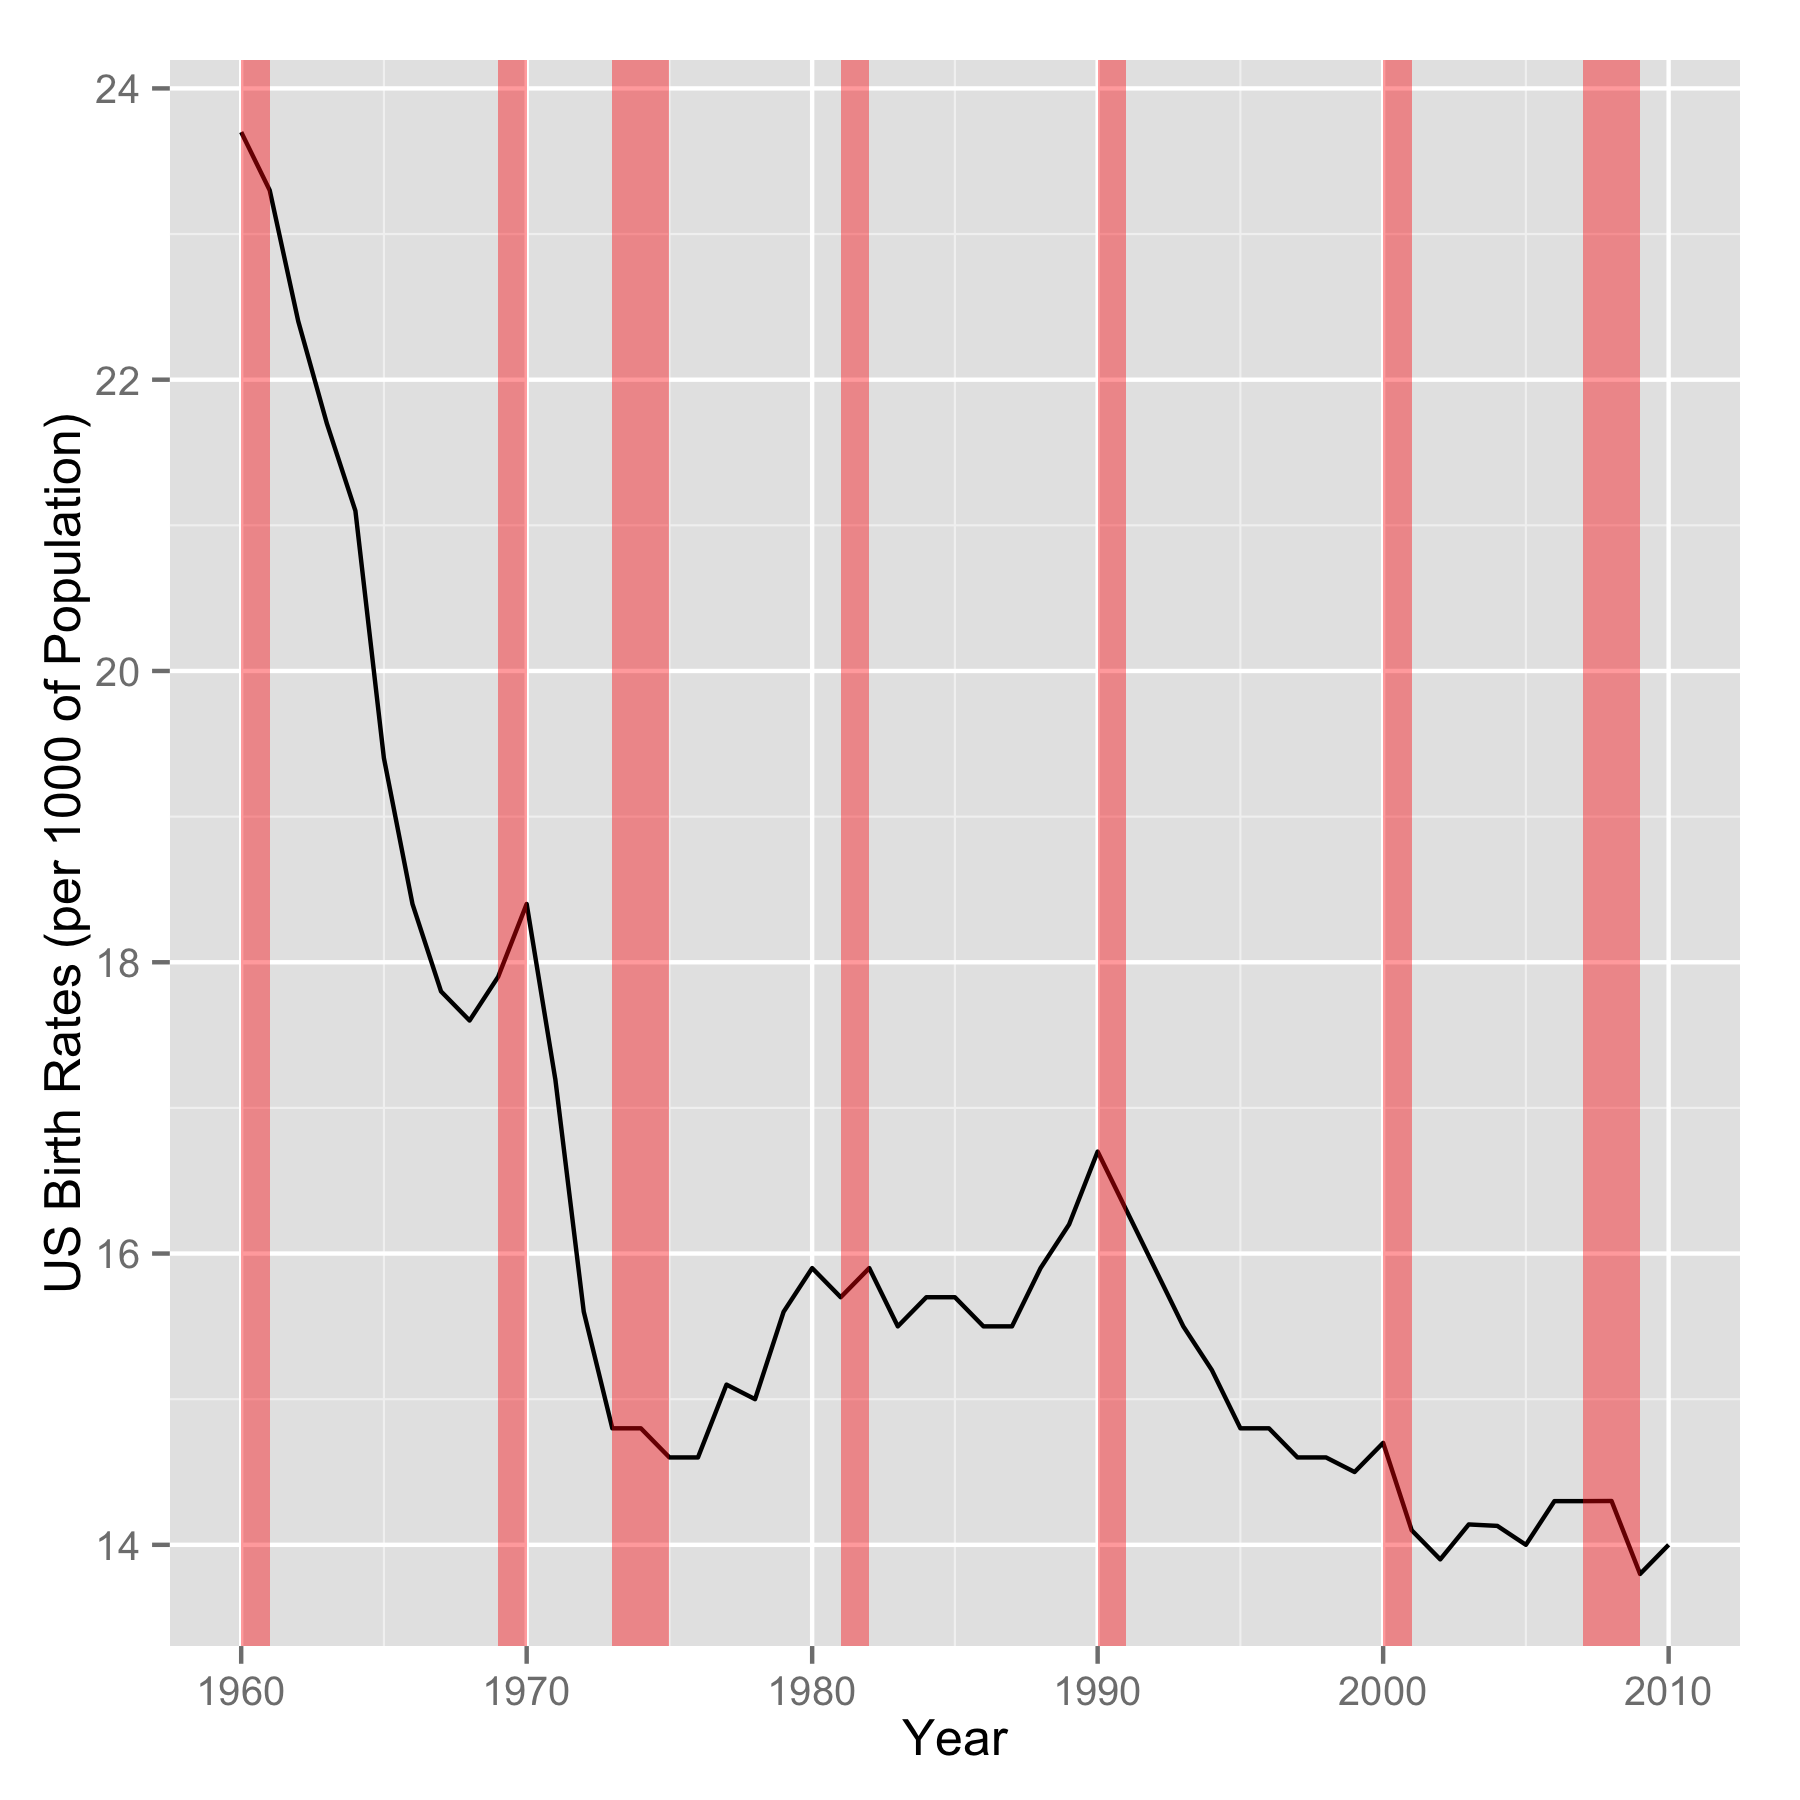
I want to take a small aside here and try to understand why this enrollment decline might be happening.  There are likely to be a number of factors behind it, but it would seem to me that the birth rate should be a sensible thing to look at as an enrollment predictor.  It would be nice to have more enrollment data to do a correlation study with, but I just don’t have them.  Birth rate data, on the other hand, is somewhat easier to get.  Not for the state, of course, that would be too convenient.  Plotted below are the US birth rates (live births per 1000 people) since 1960, and plotted along with them are US economic recession years (in red).  It isn’t too surprising to mee to see that all of the significant drops in birth rate coincide with recession years.

Take note of something interesting.  You would expect a 5 year lag between birth rate changes and their impact on enrollment.  2000-2001 was the last recession drop, which is in line with our 2006 enrollment decrease.  Both data sets are roughly flat the few years prior to the drop as well.  If this means anything, it should allow us to make plans for future enrollments in the public schools.

US Birth Rates since 1960.  Recession eras are shown in red.

US Birth Rates since 1960. Recession eras are shown in red.

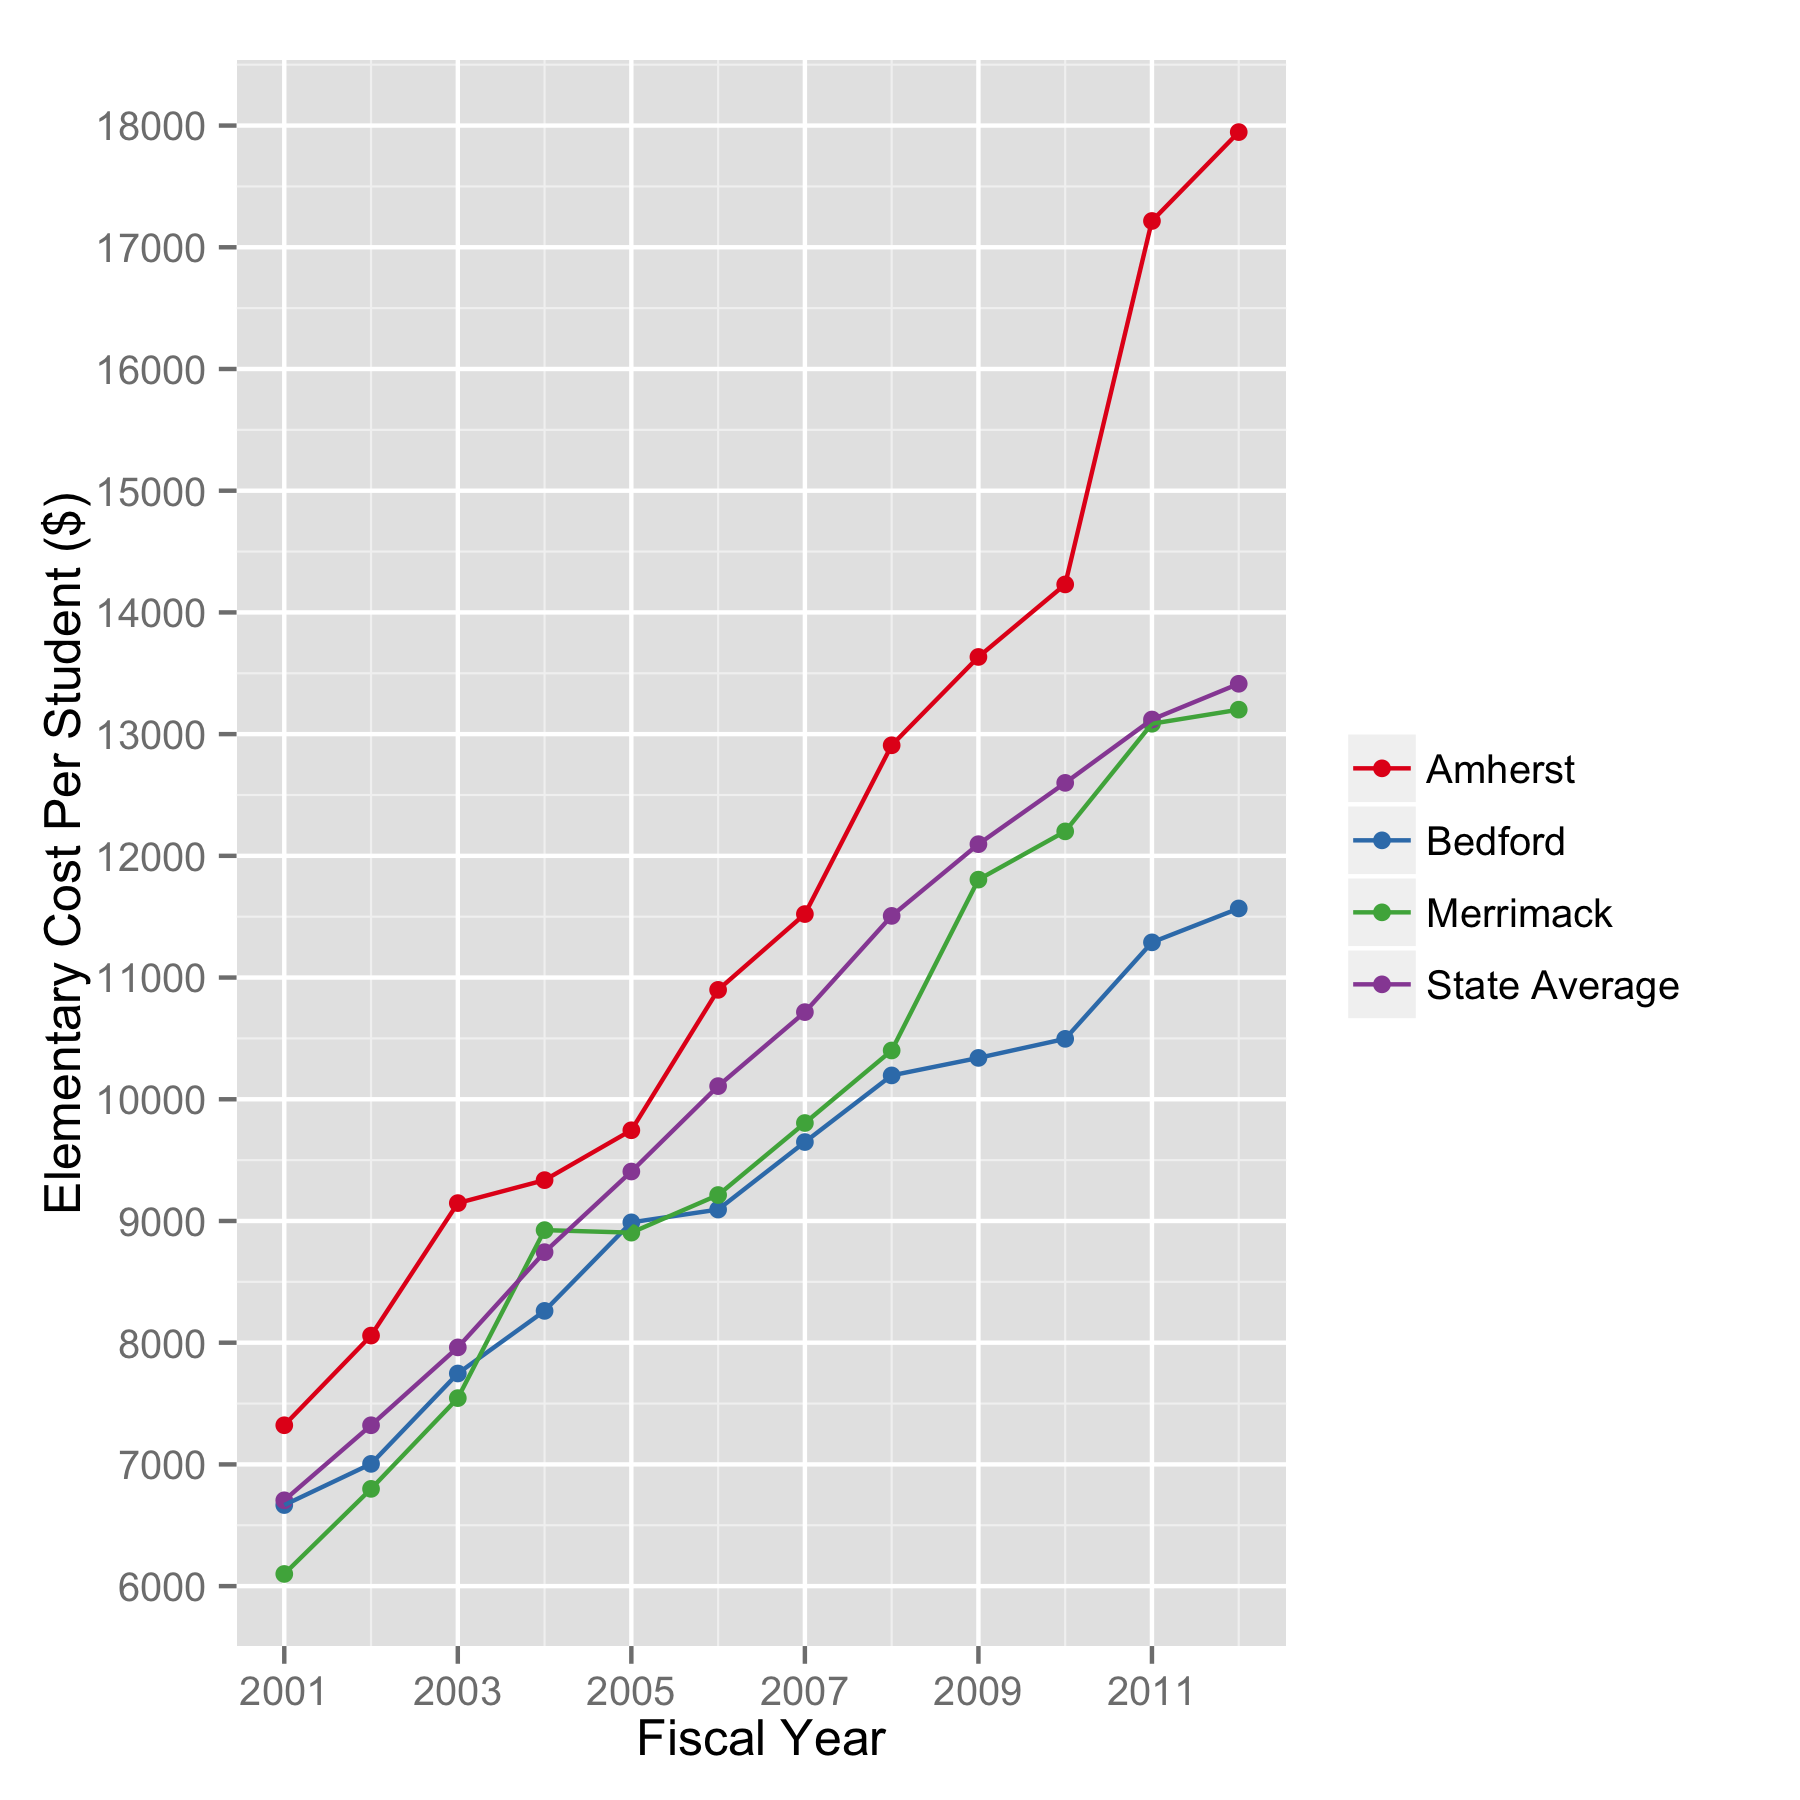
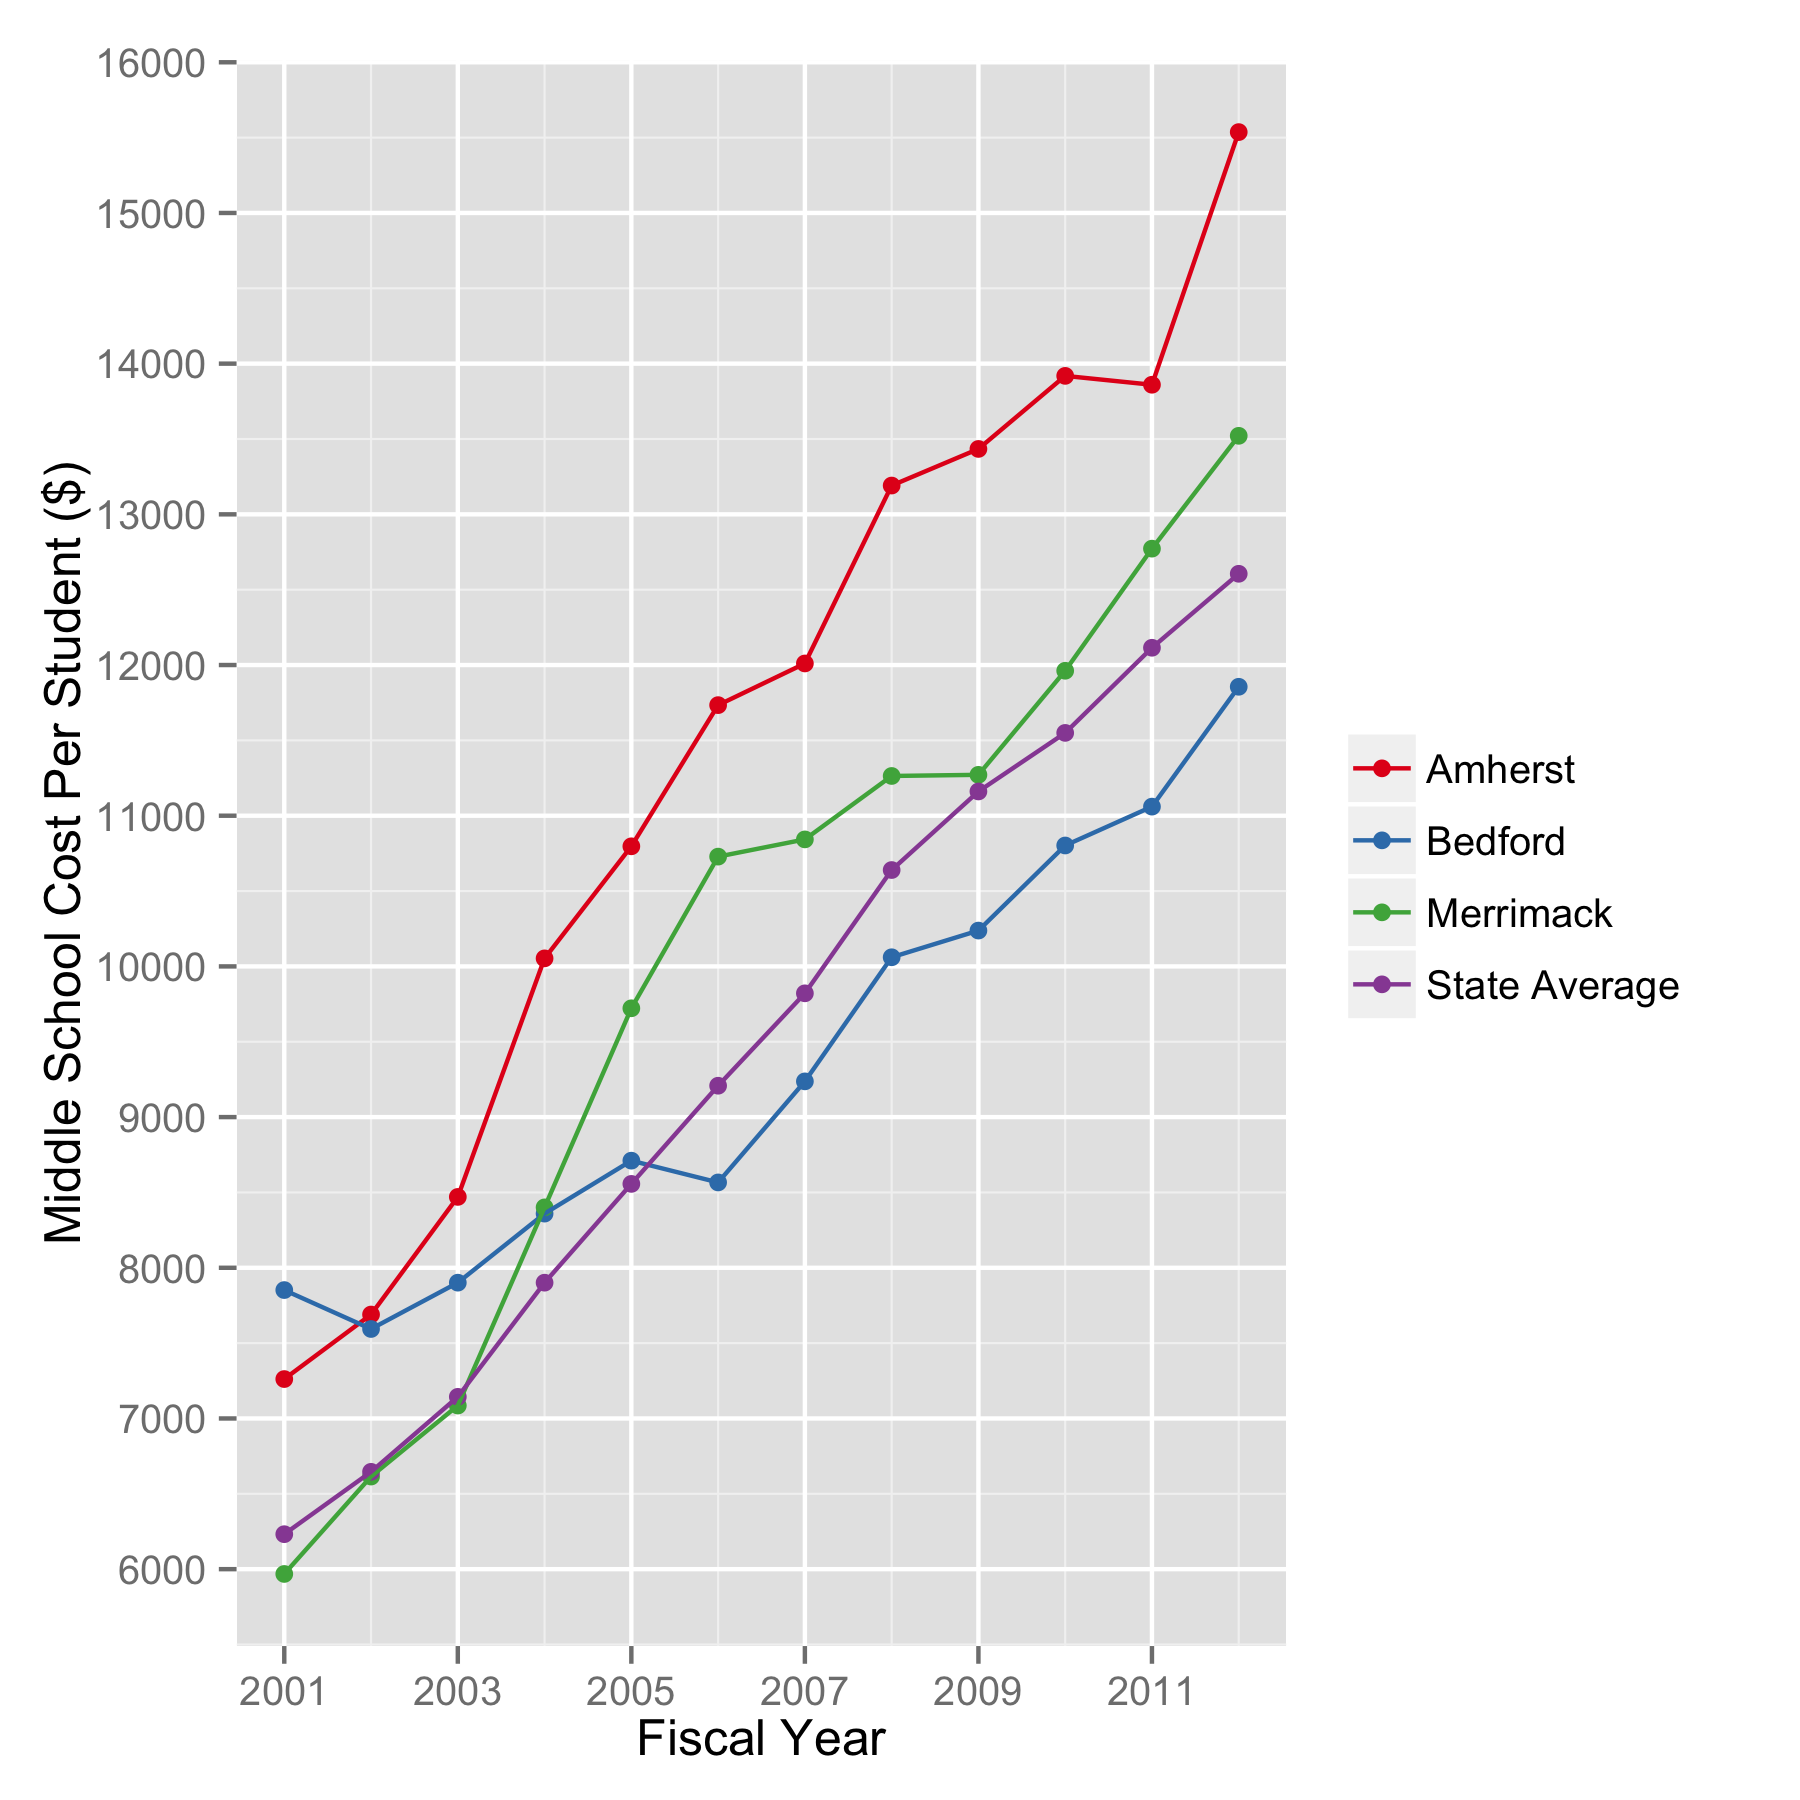
Now since we have both spending numbers and enrollment numbers, let’s take a look at the all important “total spending per student” number.  The school administration officials don’t really seem to like this number.  It is true that the Dept. of Education uses a different algorithm to calculate per student spending.  This is because they only use education spending, as opposed to total spending, in their calculation, which allows them to compare districts based on education costs alone.

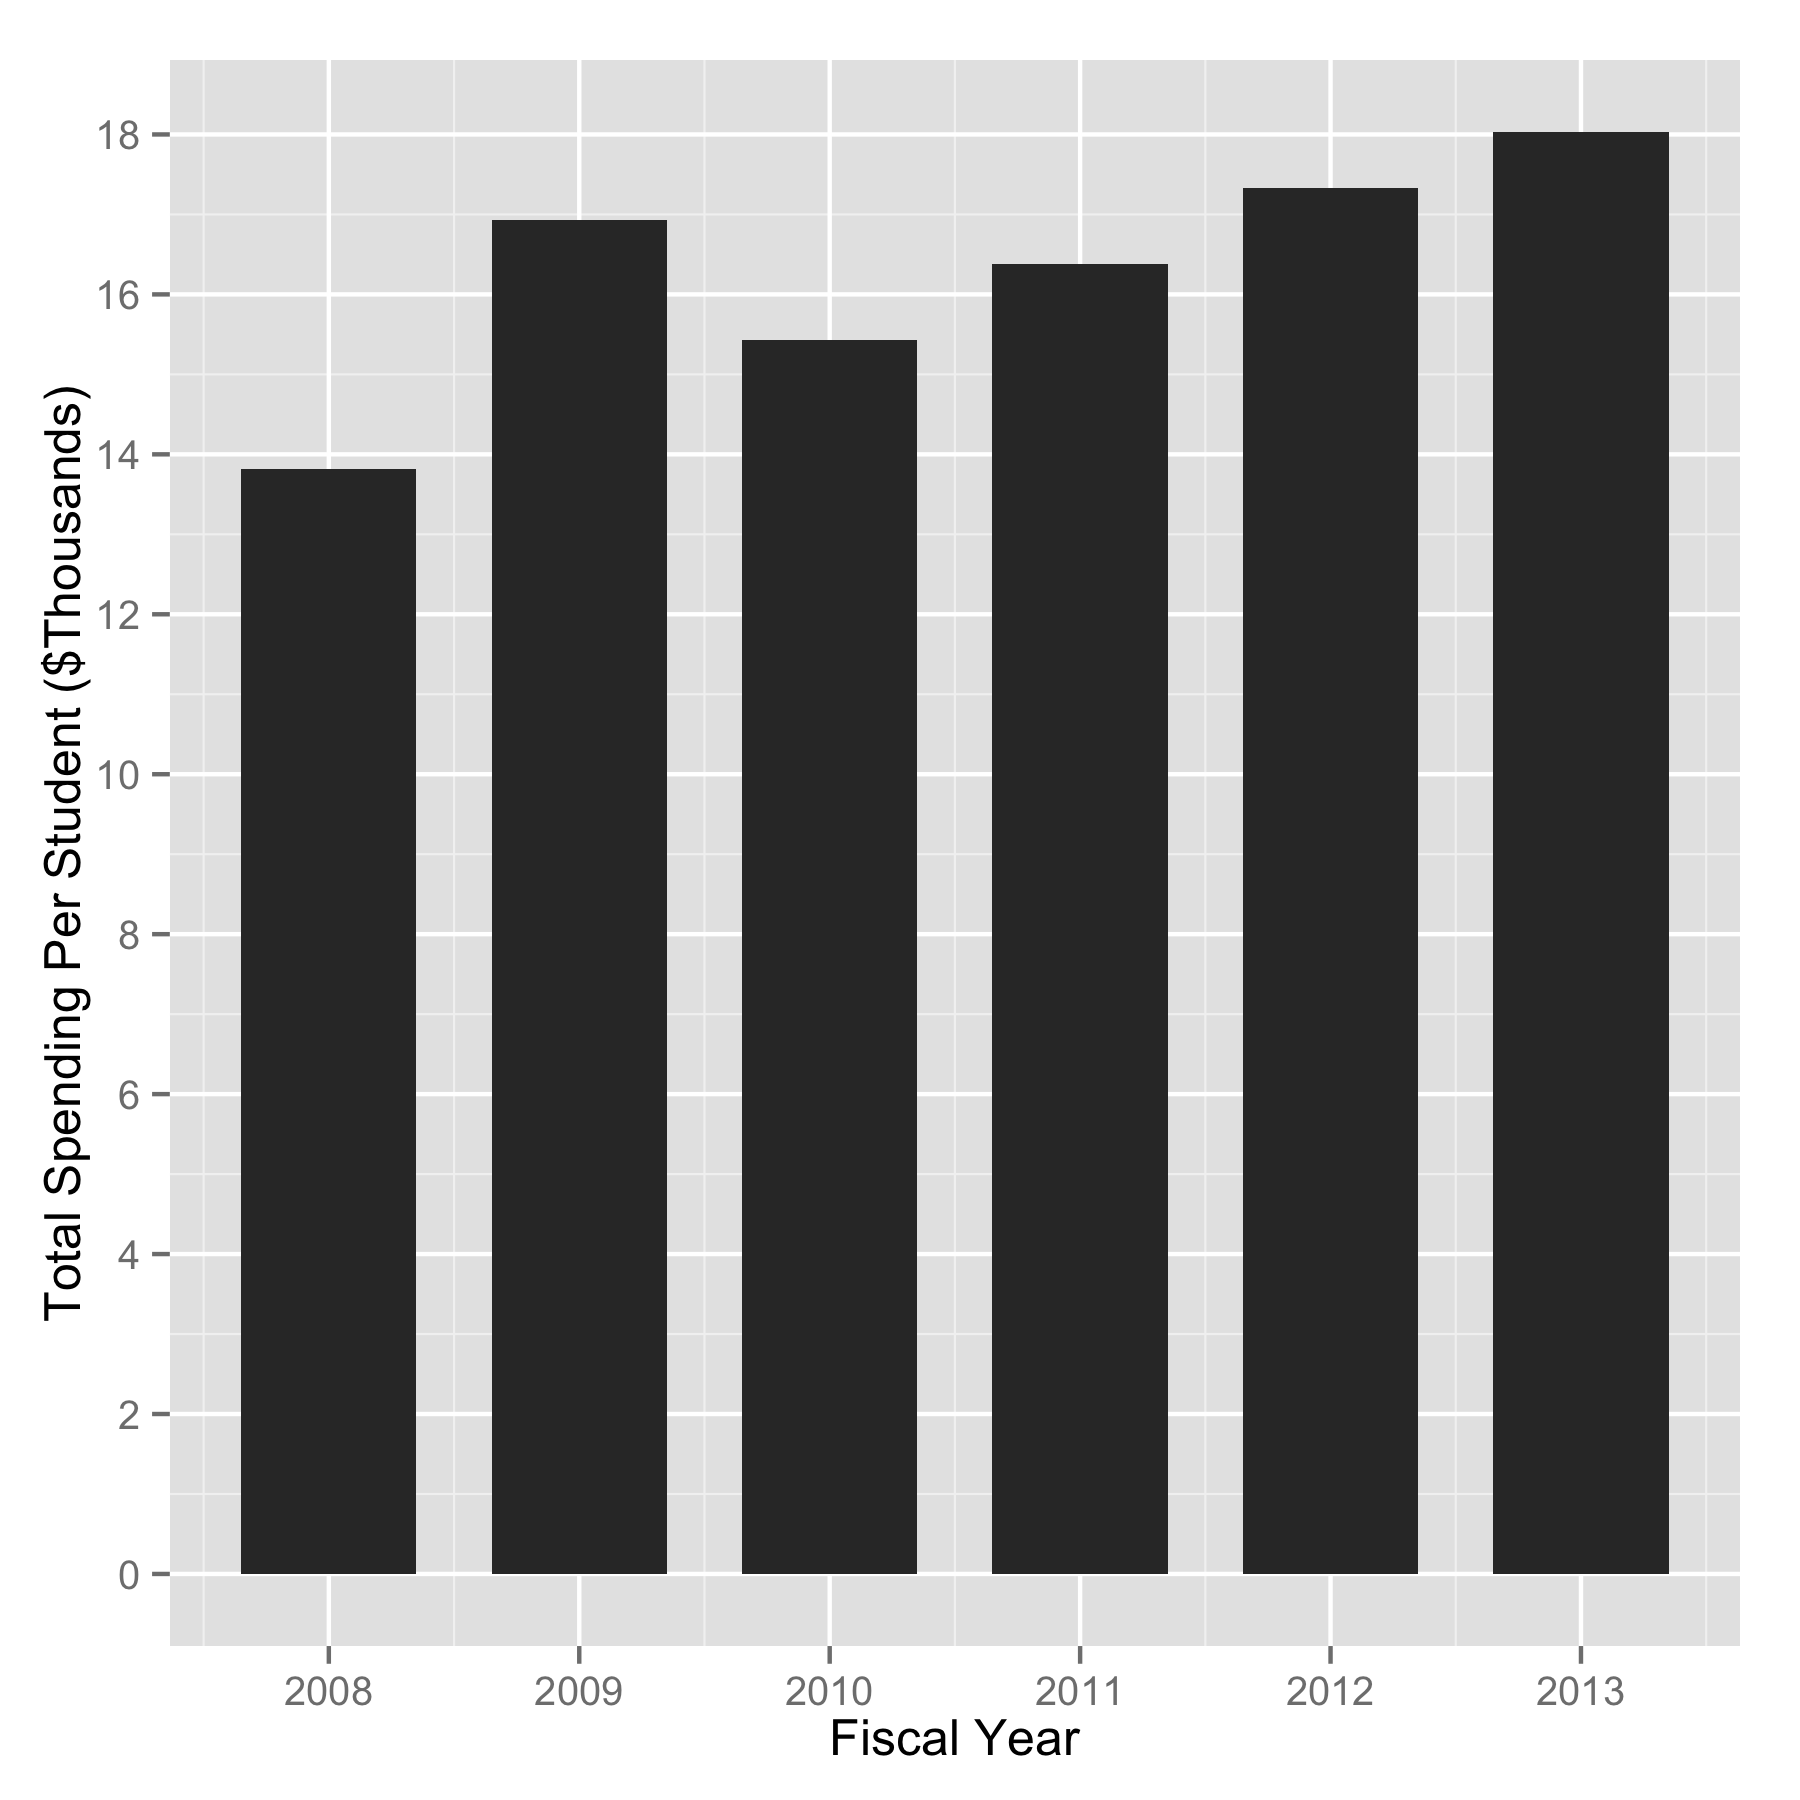
That’s all fine and good, but our per student cost is our per student cost.  Pretending it is something other than what it is doesn’t benefit anyone.  Below is a graph of our per student costs since FY08.  These are total expenditures divided by enrollment for the year.  Yes, we have reached $18,000/student in K-8 spending.

The total spending per student for the Amherst School District.

The total spending per student for the Amherst School District.

The District has not managed to control costs.  That’s about a 30% increase from 2008 to 2013.  Granted, things like teacher retirement costs are out of their control. And for the first time in many years, next year’s ASD budget (FY14) did not increase.

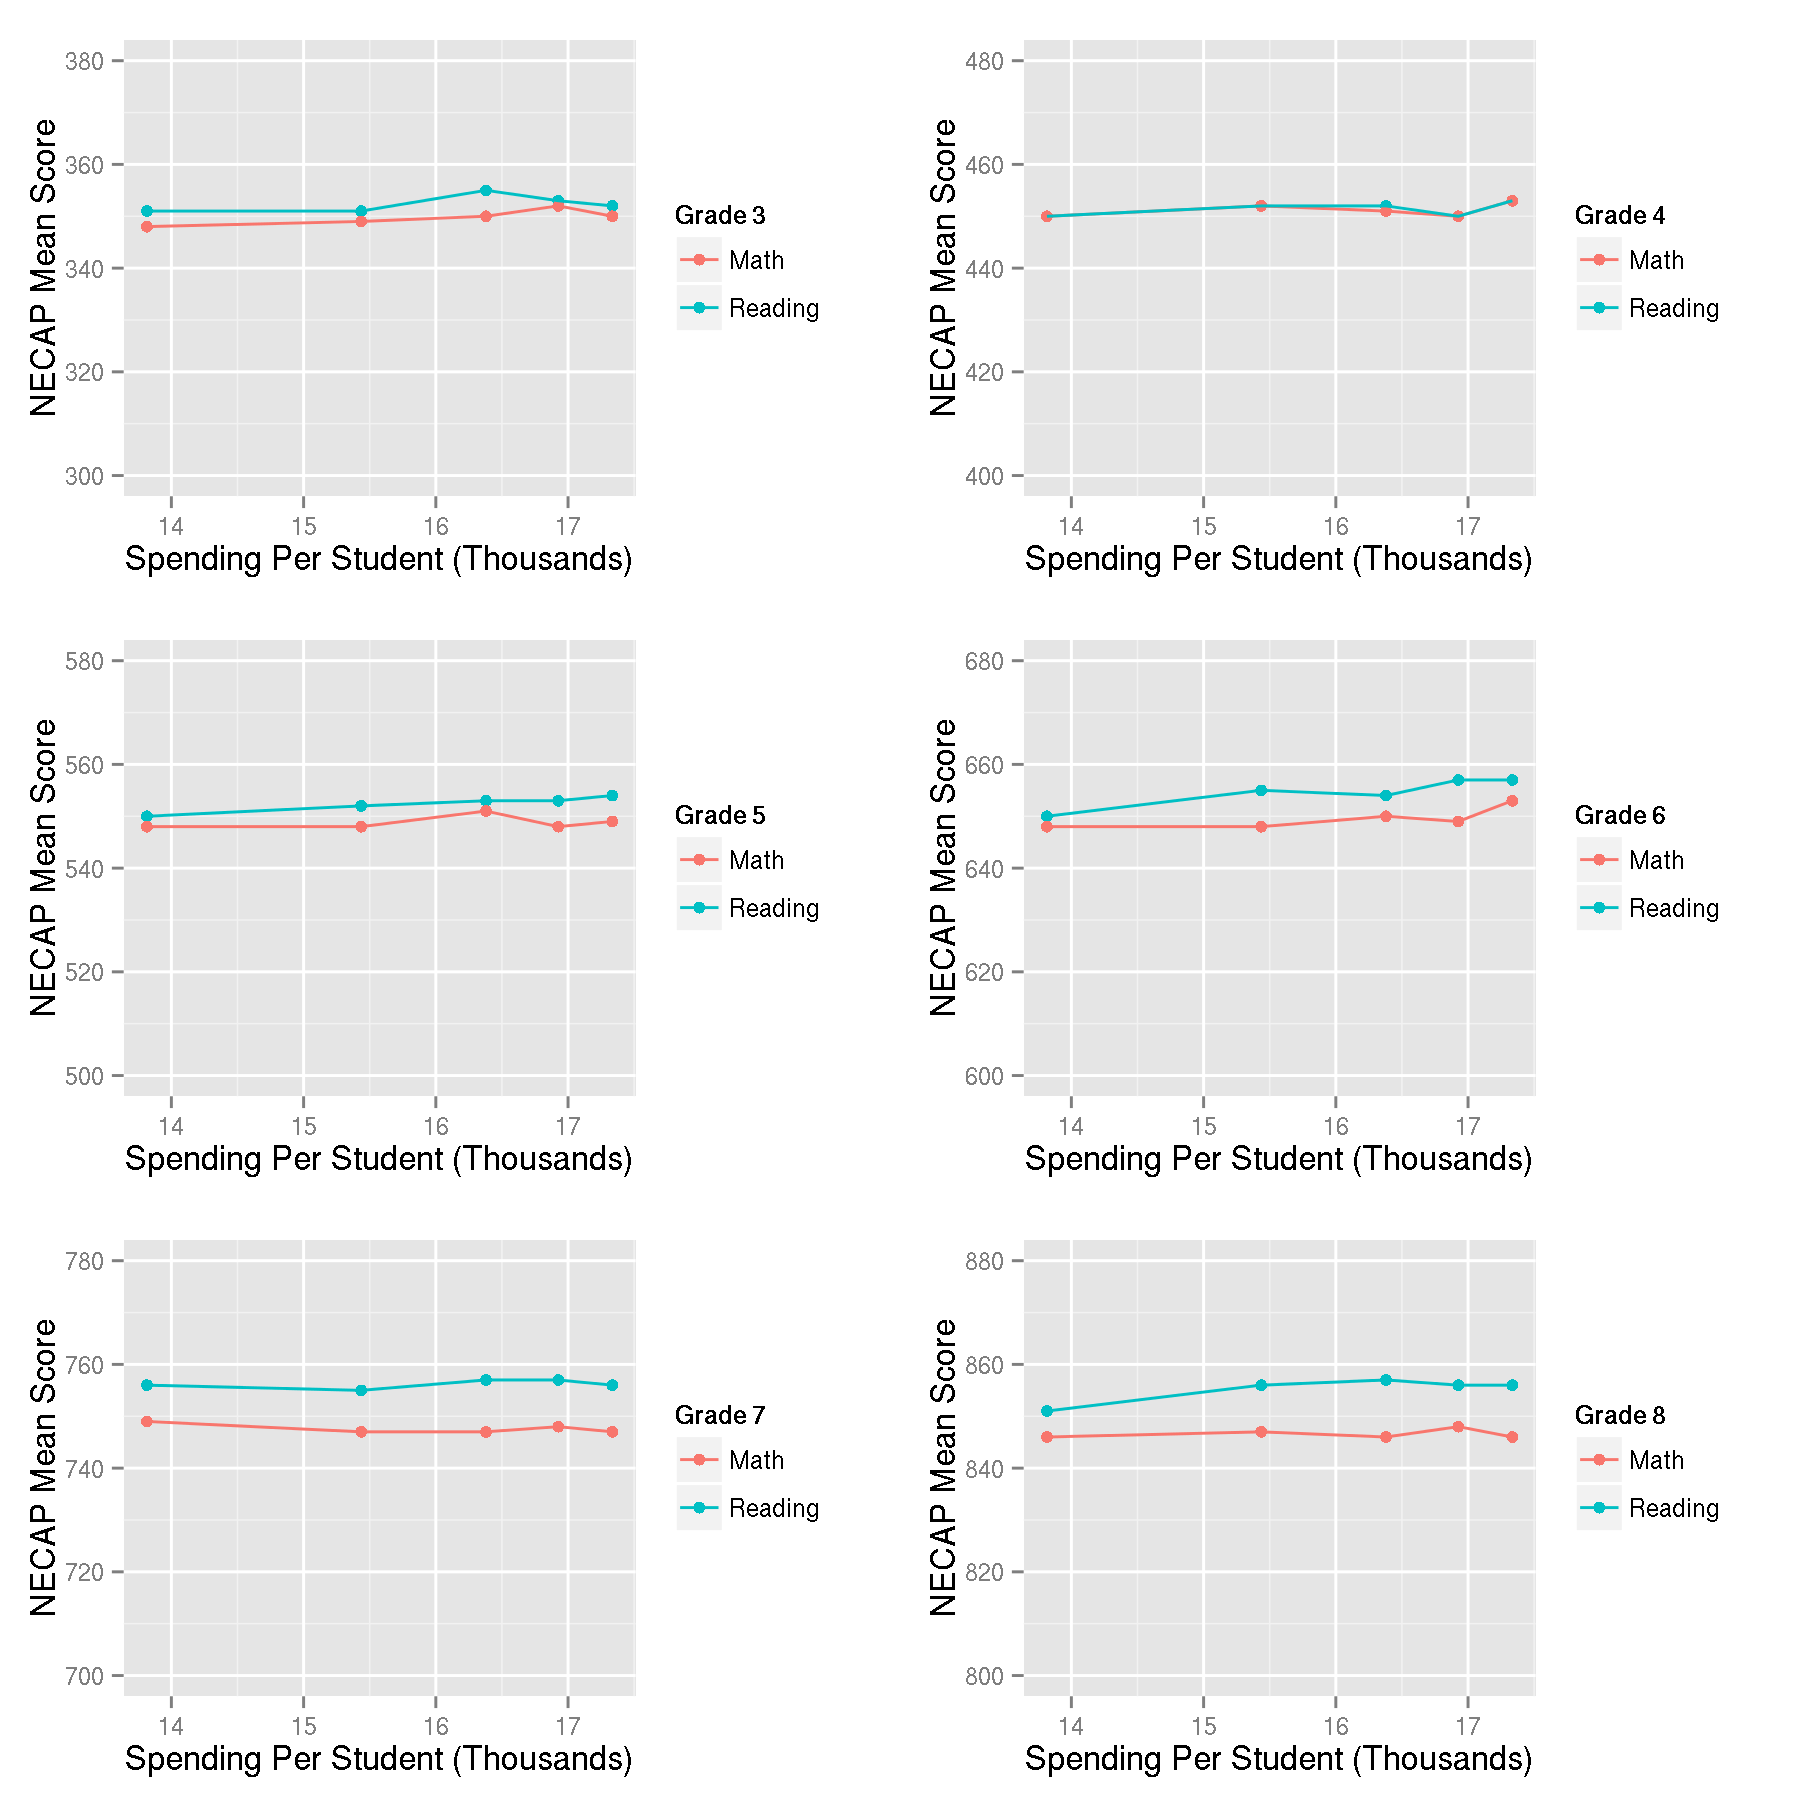
My question is what actions can be taken to get the primary budget increase drivers under control?  And the most important question that needs to be answered, have we realized any additional educational value for those increased costs?