Amherst Property Taxes and Inflation

One of the questions I was asked after yesterday’s post on property tax growth was on how inflation factors into the picture.  My original intent was to measure the actual change in property tax bills, but it is instructive to add the inflation perspective.  There are a handful of inflation rate calculators available online that will let you make adjustments for constant dollars.  Since my property tax information starts in FY 2001, I’ll use constant 2001 dollars here.

Inflation essentially measures the change in buying power of a currency over time.  That is, if something cost $1 in 2001, because of inflation it will cost a few cents more in 2002, and so on.  You’re probably already made the observation that things cost more at the store, this is generally due to inflation.  How it impacts you depends on whether your income has kept pace with inflation or not.  The easiest way to look at this is to put together a table of multipliers for each year, referenced to 2001 (graphed below).  This will allow us to recalculate the tax data from yesterday in terms of constant 2001 dollars.

Inflation multipliers to determine constant 2001 dollars in US currency.

Inflation multipliers to determine constant 2001 dollars in US currency.

The overall effect of taking inflation into account, particularly when it is increasing as we see above, is to shrink the value of the dollars being spent in time.  What it allows us to see is whether the changes in the numbers come from changes in the value of the dollar, or whether actual spending has changed.  Given what we know about health insurance costs in our school district, we should not be surprised to see that actual spending increases here.

Last time I broke out the education dollars for the towns that were raised by local property taxes and we looked at how they changed over time.  Below is that information replotted in constant 2001 dollars.  Amherst has a growth factor of about 1.7, Bedford hits 2.4, and Merrimack 2.2.

Locally raised education spending by town in constant 2001 dollars.

Locally raised education spending by town in constant 2001 dollars.

Likewise, here is the total property tax growth of the towns in constant 2001 dollars.  Again, very similar to yesterday’s plot.  Amherst comes in at a real growth factor of just under 1.4, Bedford at 1.7, and Merrimack at just over 1.4.

Changes in the total property tax burdens of Amherst, Bedford, and Merrimack in constant 2001 dollars.

Changes in the total property tax burdens of Amherst, Bedford, and Merrimack in constant 2001 dollars.

Advertisement

Budget Review Slides Submitted to Administration and School Board

With all the work I’ve done to better understand how and where we spend money in Amherst School District, it was time to do something with it and press for some changes.  My intention is to refocus the budgeting process before it happens, rather than respond to it once it comes out.  I’m hoping the proactive approach is the more effective one. That in mind, I summarized my budget evaluation (which I’ve done in bits and pieces here) and questions/recommendations in some slides and met on Wednesday (7/17/13) with the Superintendent (Peter Warburton), the Business Administrator (Betty Shankel), and the ASD School Board Chair (Peg Bennett) to review them.

It was a good meeting, the contents were well received, and once they have fully digested them, we will meet again with a larger group to review them and their responses to the questions and recommendations. I think I got my point across that I was there for a cooperative meeting and that I wanted to drive the discussion on where W&M sees issues that need to be addressed earlier in the process than has been typical.  We are supposed to be the check/balance in this process and the points made were, I think, well received (we were encouraged to push them on spending issues).  I openly invited them to suggest other metrics to judge value if they feel I have selected incorrect ones (mostly because last year’s W&M committee meetings did not produce any metrics I was looking for).  And in general, that if they feel that the numbers for certain spending areas are justified (special education and teaching coaches come to mind)  in how they deviate from state averages or other town numbers, that the case needs to be made for them.

These are the slides.  I talked over them quite a bit in the meeting, but hopefully the messages are clear.

Amherst School District – Per-Student Spending and Special Education Budget Comparison

Recently I was preparing some charts to go over at the beginning of this year’s Amherst School District Ways and Means budget meetings.  I’ve gone through our budgets quite extensively trying to understand what our costs are and how we can control them.  One thing I look at is per-student spending, which we’ve gone over before.  What I really wanted to understand is how we compare with some of our neighboring towns.

Luckily, the state Department of Education puts their numbers online.  The state does the calculation somewhat different than you might expect as they remove certain budget areas like transportation and food service from the calculation.  With that in mind, these are the state’s cost per student numbers for elementary school education in Amherst, Bedford, Merrimack, and the state average as reported by the NH DOE from 2001-2012.

Per Student Costs by Fiscal Year For Amherst, Bedford, Merrimack, and the State Averages, by Fiscal Year.

Per Student Costs for Elementary Education by Fiscal Year For Amherst, Bedford, Merrimack, and the State Averages.

So according to the state, in FY 2012 we outspent the state average by $4533/student, Bedford by $6378/student, and Merrimack by $4745 in elementary school education.  Go back and read that again.  I found this to be remarkable.  And a little surprising.  We need to understand why Amherst’s numbers are so very different from our neighboring towns.  Those other New Hampshire towns have the same health insurance and NH Teachers Retirement fund constraints that we do, so those probably aren’t the drivers.

For the record, here are the middle school numbers.  We’re high there too.

Per Student Costs (Middle School) by Fiscal Year For Amherst, Bedford, Merrimack, and the State Averages, by Fiscal Year.

Per Student Costs for Middle School by Fiscal Year For Amherst, Bedford, Merrimack, and the State Averages, by Fiscal Year.

The table below has these cost/student numbers for just FY2012, and includes the numbers for the total district.  Keep in mind that Bedford and Merrimack don’t have multiple districts in their towns like we do, so their district numbers include high school (for the record, our Souhegan HS district comes in at $18,456.28/student in FY2012 according to the state).

Elementary Middle School District
Amherst $17,946.34 $15,536.66 $16,569.40
Bedford $11,567.85 $11,855.69 $11,385.20
Merrimack $13,201.02 $13,521.11 $13,157.54
State Average $13,413.70 $12,605.50 $13,159.15

I was pleasantly surprised to find that both Bedford and Merrimack school districts have their FY14 school budgets available online.  I have not yet done a thorough analysis to see how they compare with things we’ve already looked at, like health insurance.  But to try to understand how they spend so much less per student than we do, I took a quick look at their education spending and found something remarkable.  Amherst School District’s budget is heavily weighted in Special Education.  Considerably more than neighboring towns.  Here are the numbers, including the percentage of the budget spent on Special Education.

School FY14 Total Budget FY14 Special Education Budget % Special Education
Amherst $24,278,572.00 $5,073,488.00 20.9%
Bedford $62,660,875.00 $9,882,992 15.7%
Merrimack $67,291,503.00 $10,171,841.00 15.1%

Now these are telling numbers.  In Amherst we are spending between 4 and 5 percentage points more of our budget on Special Education than our neighboring towns. This is a lot of money.  Why these numbers are so different needs to be understood.

Now what would our budget and cost/student look like if we had the the Special Education budget percentages of Merrimack or Bedford this upcoming school year?  I ran the numbers using Merrimack’s spending:

  SPED @ 20.9% SPED @ 15.1%  
Special Education: $5,073,488.00 $3,415,745.21  
Total Budget: $24,278,572.00 $22,620,829.21  
Cost/student: $17,984.13 $16,756.17  

That is to say, if our special education spending was in line with neighboring towns, we would shave about $1.5 million off of our bottom line budget and reducing our spending/student by around $1200.  What I take from this is that we are extravagant in several areas in Amherst School District, Special Education being only one of them.

Amherst Cemetery Lot Inventory and Time Remaining

I spent some time at the Department of Public Works here in Amherst looking at the remaining lots (unsold) in Meadowview Cemetery.  I wanted to be able to make a calculation of how many years of usage are remaining at Meadowview as a double check on what the Cemetery Trustees have said.  It turns out that we have the capacity for 661 burials left at Meadowview Cemetery.  Here’s the breakdown:

Lot Type Number of Lots Burial Capacity
Single Lots: 66 66
Double Lots: 225 450
Triple Lots: 27 81
Quadruple Lots: 16 64
  Total Capacity: 661

To answer the question of how many years until the cemetery is full, we have to consider a few things – how many burials we make per year, and how many of those burials require a new lot.  This is because people can purchase lots today for usage in the future, and those lots make up the majority of the ones used for burials. So let’s go back over our burial rate in Amherst cemeteries.  Over the last 80 years, the average burial rate is 22/year, plus or minus 6.  We have seen this here before.  Remember that the current year’s number is not for the full year.

Annual number of burials in Amherst, NH cemeteries. Data from Department of Public Works records.

Annual number of burials in Amherst, NH cemeteries. Data from Department of Public Works records.

And we have numbers for lot sales, though unfortunately not for the same range of years.  To make this simpler, we will just look at the percentage of burials using previously purchased (perpetual care) lots here.  The most recent number is around 60%.  The details on where these come from is here.

Percentage of Amherst cemetery burials using previously held (perpetual care) lots.

Percentage of Amherst cemetery burials using previously held (perpetual care) lots.

So now we have what we need to know.  Let’s do the “most likely” analysis using the 80 year average burial rate (22/year) and the 60% number for perpetual care lot usage from the graph above.  That means 40% of the burials require new lots taken away from the 661 we have today.  So how long will it take until Meadowview is full?  Answer: 75 years.

Current Lot Inventory: 661
Burials/year: 22
Percentage using newly purchased lots: 40
New Lot Purchases/year: 8.8
Previously Sold Lot Usages/year: 13.2
Time to exhaust inventory (years): 75.1

Let’s take a “worse case” scenario and use the 28/year burial rate (22+6) and the same new/perpetual care split.  How many years are left at Meadowview then?  Answer:  59 years.

Current Lot Inventory: 661
Burials/year: 28
Percentage using newly purchased lots: 40
New Lot Purchases/year: 11.2
Previously Sold Lot Usages/year: 16.8
Time to exhaust inventory (years): 59.0

Obviously these hold so long as past trends continue into the future.  Who knows if or when our increase in population may eventually start to show in our burial rates.  But notice that it hasn’t for 80 years.  And we have no idea how many perpetual care lots are left to be used, because no one really keeps track of that specifically.  So let’s take this one step further and imagine there are no perpetual care lots left to use, and we use our statistical high rate of 28 burials/year rate, all of which take up a previously unsold lot.  This would be our “worst case” scenario.  How long then?  Answer:  23 years.

Current Lot Inventory: 661
Burials/year: 28
Percentage using newly purchased lots: 100
New Lot Purchases/year: 28
Previously Sold Lot Usages/year: 0
Time to exhaust inventory (years): 23.6

Amherst School District – Value and Trends in Standardized Testing (Part 1)

Before I changed my college major to Physics, I studied Electrical Engineering.  One of the ways electrical engineers look at complex circuits is to replace them with imaginary black boxes.  They can then measure what goes into the black box (inputs), and also what comes out of it (outputs), and from those measurements they can learn how the black box behaves without knowing too much about the details of what goes on inside of it.  This sort of approach can be useful in understanding the behavior of other complicated systems, school districts included.

We spend a lot of time evaluating things like budgets, staffing, and enrollment for the district – these are all inputs.  We can analyze spending areas and benefit costs over time, but these are just detailed views of some parts of these inputs.  What we haven’t looked at yet are outputs, and they are overdue for some attention.

So what are the outputs of a school district?  Different people will have different answers to this question.  For me, I’m going to say “educated students” as that is the reason the district was created – to educate the children of Amherst.  Measuring the level of education is an important, but complicated task.  Few professional educators I know can agree on a satisfactory way to measure it, and there are plenty of disagreements on what the measurements that are made actually mean.

But we shouldn’t let the lack of a perfect measurement stop us from making any measurements at all, and we should look very closely at the ones that we can make, or in this case, already have been making.  At the beginning of each school year, the New England Common Assessment Program, or NECAP, tests are given to children in grades 3-8 for reading and for math.  There are some other subject tests given, but not to all grades each year. The results of these tests for Amherst School District are posted on the New Hampshire Department of Education website (see the NECAP Longitudinal Reports section toward the bottom of the page).  There you will find the percentage of students that score proficient or above in each subject, and also the average scaled scores, both of these for each grade level tested.  Now if you’ve been following along with anything else on this website, you know that I’m about to show them to you.

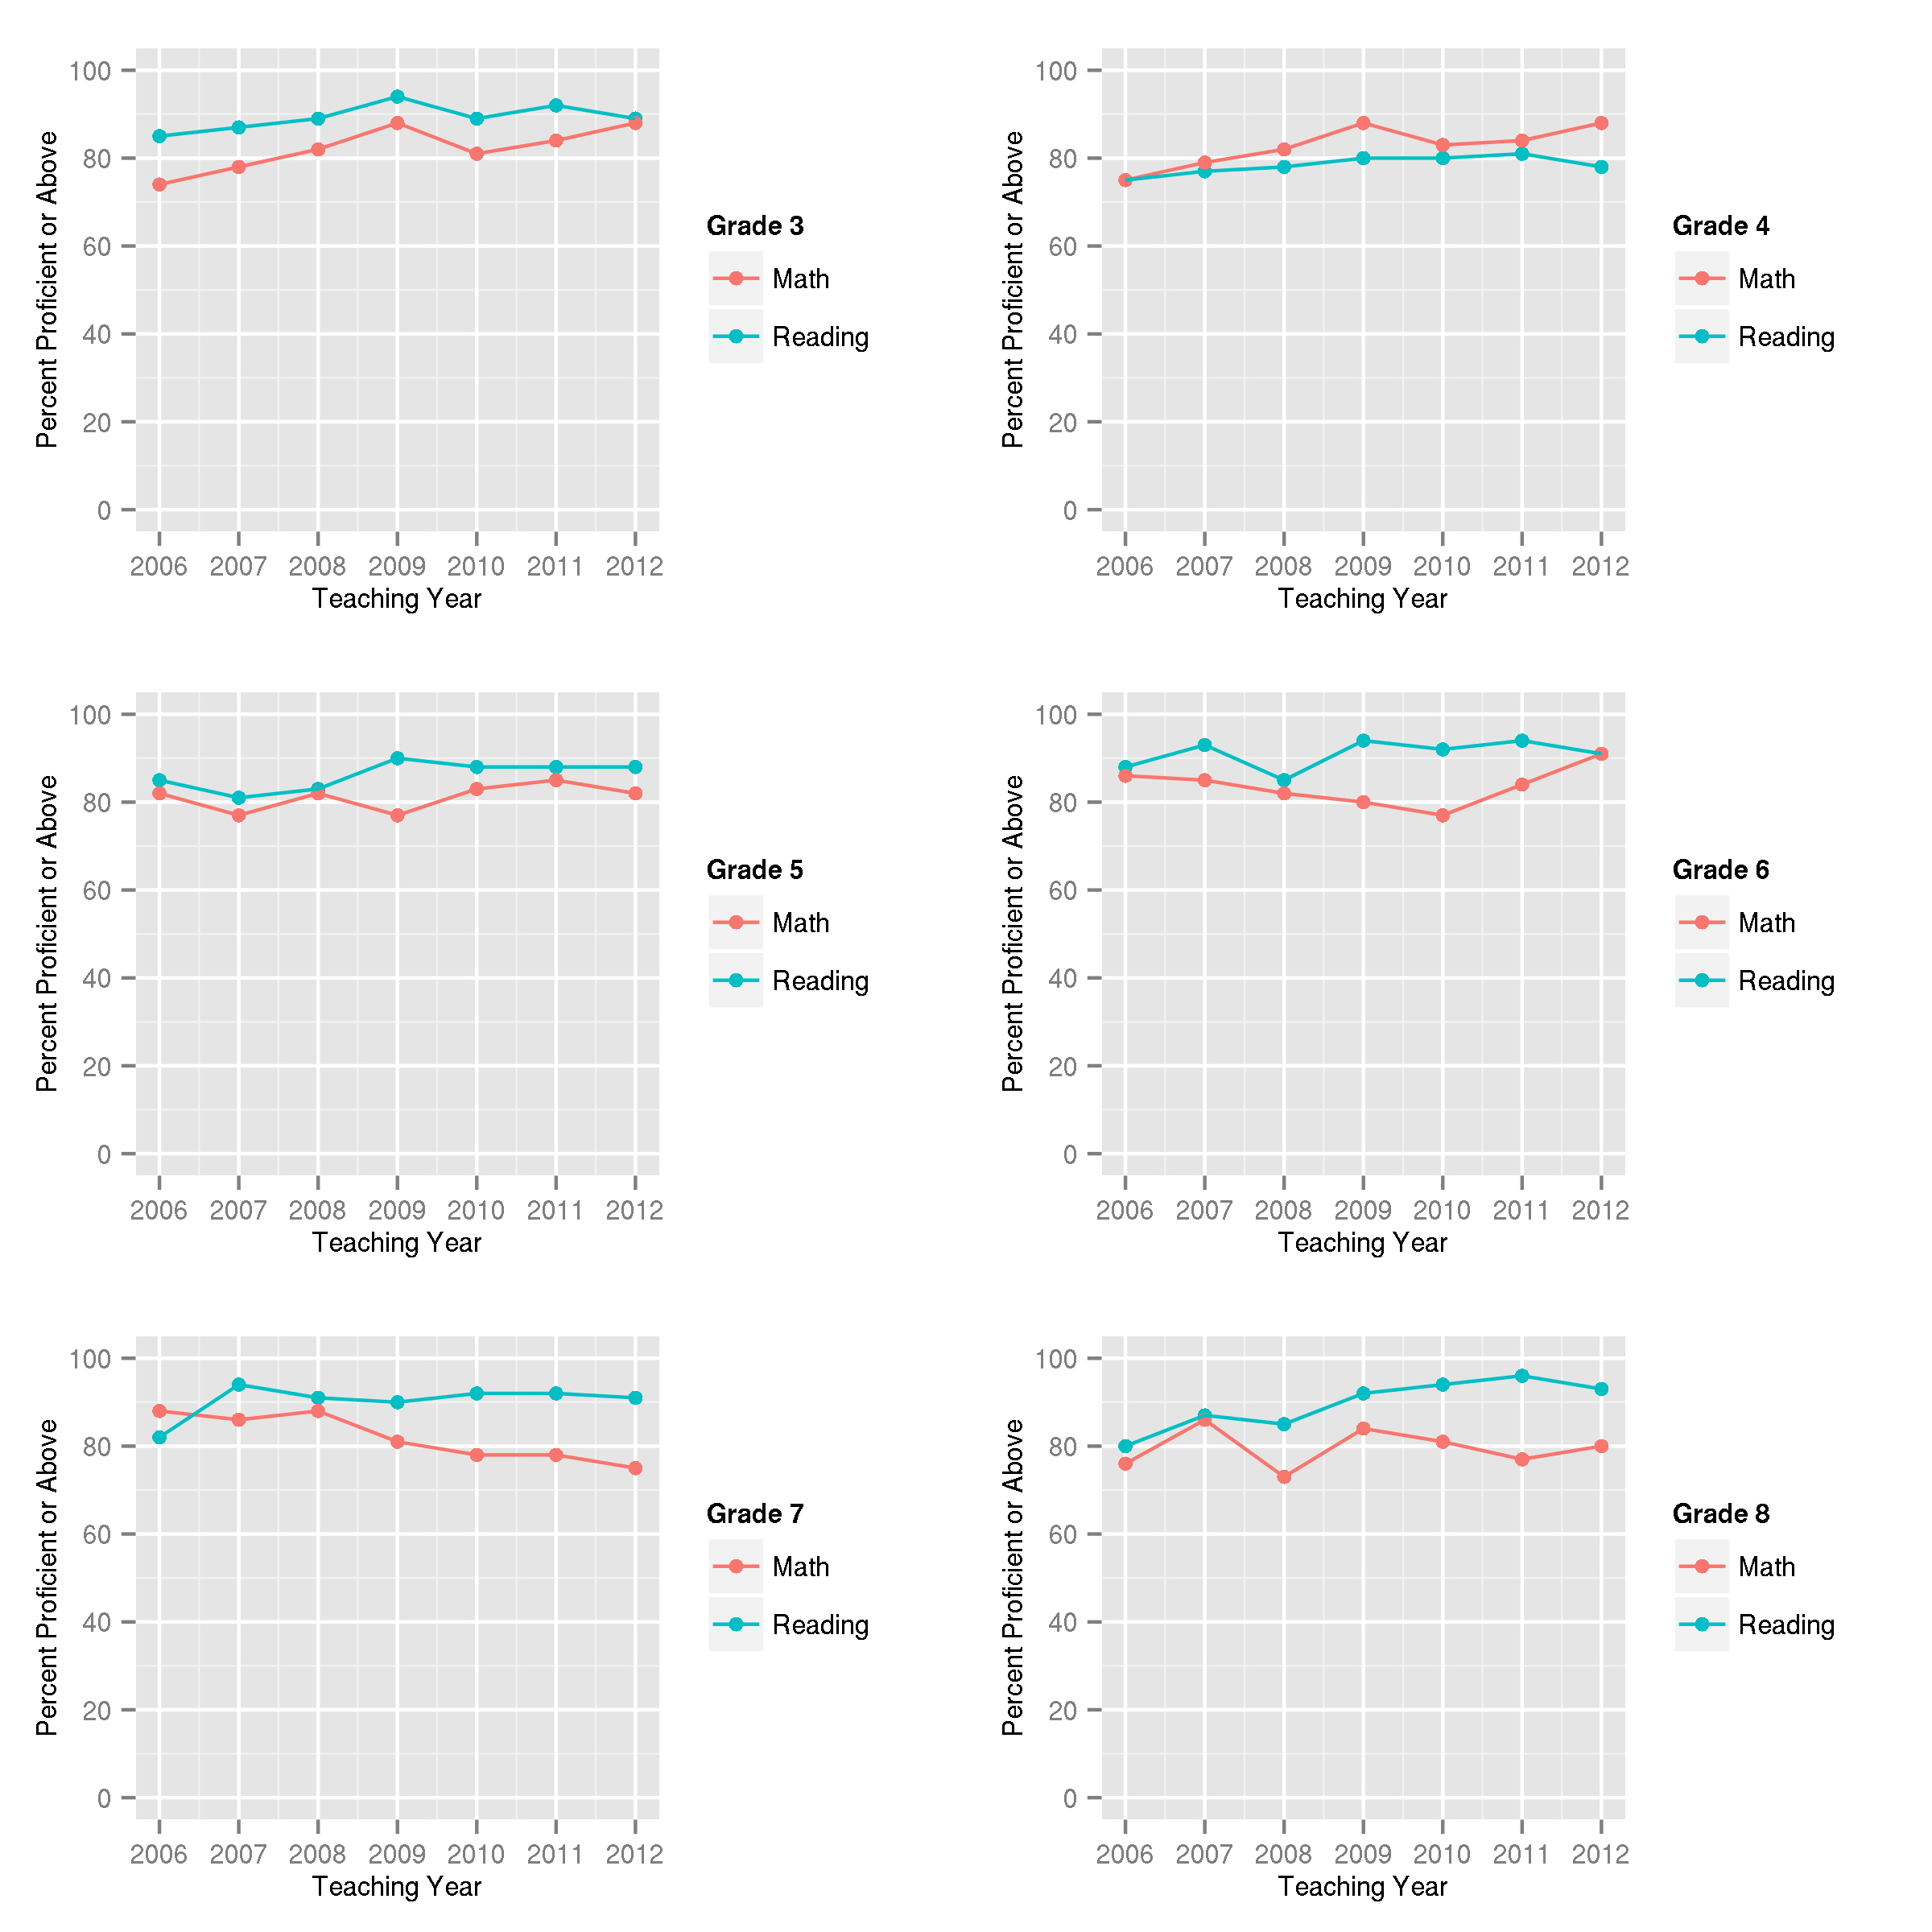
Below are the individual grade level NECAP testing results for math and reading for teaching years 2006 through 2012.  Plotted first are the percentage of students scoring proficient or above for grades 3-8.  (Note:  The NECAP test for teaching year 2006 is given in the Fall of 2007, etc.)

Amherst School District NECAP data for math and reading.  Scores are reported for teaching year.

Amherst School District NECAP proficiency data for math and reading. Scores are reported for teaching year by grade.

Apart from the steady decline in the percentage of 7th graders testing proficient in math, nothing really jumps out here.  That is the problem.  Can you pick out the year we hired the literacy coaches from the reading results?  How about year we started with math coaches? I’ll admit that I’m having trouble figuring those out myself.

Perhaps we will have better luck looking at the average test score numbers.  So here they are broken down by grade, same style as above.  NECAP has an odd scoring system.  The scores are created by adding the grade level in the hundreds place, plus a numeric score that ranges from 0 to 80.  This strikes me as a very poor way to represent test scores, but here they are on comparable scales.

NECAP average scores for Amherst School District.  These are the mean scaled scores each year by grade.

Amherst School District NECAP average scaled scores for math and reading. Scores are reported for teaching year by grade.

Similar to the proficiency percentages we looked at before, there are a few years with some modest gains, but there are some modest losses as well.  What is quite clear is that since teaching year 2006 we have seen no significant improvement in reading or math standardized test scores, or the proficiency percentage of students tested.  Now would you be surprised to find out that we’ve added about $4 million to the Amherst School District annual budget in this amount of time (i.e. going from about 20 up to 24 million)?  This is where the question of value comes in.

There may or may not be better ways than NECAP to measure individual student performance, but that is an issue for a different time.  Standardized tests are generally accepted to be a reasonable way to make year-to-year comparisons for establishing progress on a broader scale.  And I think the numbers speak for themselves that we have room for improvement in the district.  It is reasonable to guess that this was the goal behind starting our teaching coaches program.  Now I don’t want to sound like I’m picking on teaching coaches, but it is not clear that this experiment has paid off.  Rather, it looks to me quite the opposite.

I should point out that last year during the Ways and Means budget meetings, I asked the director of curriculum development about metrics demonstrating the effectiveness of the coaching program.  I was told they did not have them, but that they had a plan to get them (though the time scale was not clear).  Now consider that in the school year starting this Fall we will spend $435,000 (salaries + benefits, etc.) on teaching coaches in Amherst School District alone.  Literally millions of Amherst taxpayer dollars have been spent on the coaches program since it was started, and without any discernible impact on measured education levels in either math or reading.  That is enough to make me question the value the teaching coaches program has brought to the students or to the taxpayers of Amherst.