Budget Review Slides Submitted to Administration and School Board

With all the work I’ve done to better understand how and where we spend money in Amherst School District, it was time to do something with it and press for some changes.  My intention is to refocus the budgeting process before it happens, rather than respond to it once it comes out.  I’m hoping the proactive approach is the more effective one. That in mind, I summarized my budget evaluation (which I’ve done in bits and pieces here) and questions/recommendations in some slides and met on Wednesday (7/17/13) with the Superintendent (Peter Warburton), the Business Administrator (Betty Shankel), and the ASD School Board Chair (Peg Bennett) to review them.

It was a good meeting, the contents were well received, and once they have fully digested them, we will meet again with a larger group to review them and their responses to the questions and recommendations. I think I got my point across that I was there for a cooperative meeting and that I wanted to drive the discussion on where W&M sees issues that need to be addressed earlier in the process than has been typical.  We are supposed to be the check/balance in this process and the points made were, I think, well received (we were encouraged to push them on spending issues).  I openly invited them to suggest other metrics to judge value if they feel I have selected incorrect ones (mostly because last year’s W&M committee meetings did not produce any metrics I was looking for).  And in general, that if they feel that the numbers for certain spending areas are justified (special education and teaching coaches come to mind)  in how they deviate from state averages or other town numbers, that the case needs to be made for them.

These are the slides.  I talked over them quite a bit in the meeting, but hopefully the messages are clear.

Advertisement

Amherst School District – Value and Trends in Standardized Testing (Part 2)

Value is a word that we should probably use more when it comes to the school district.  We talked before about the black box approach to understanding complicated things.  We take something complex, like an electronic circuit or a whole school district, and put it into a big black box and simply look at what goes into it and what comes out of it, and use those to learn what it does without having to be too concerned with the details of how it all actually happens (for now, at least).  This is a great way of getting an overall look at how something behaves, and we can use it to look at its effectiveness, or value.

A useful way to think about value is to look at input/output ratios.  You do this all the time, even if you don’t realize it.  Into your car you put gas, out of your car comes miles of travel, divide the two and you get your miles/gallon ratio.  In this case, a higher number means greater value – more miles out of a gallon of gas is greater output for every unit of input and therefore more value.  We can use this same approach with our black box model of the school district.  Into our school district go money, students, and staff, and out come educated students.  The measure of the amount of education the students have is currently done, for better or for worse, with standardized tests, which is a reasonably good way to look at groups as a whole.

Previously we looked at NECAP test scores over time.  But the word value often refers to comparisons made with money – how much of something do we get for our dollar spent.  So lets look at one of the measurements of education that we can make, average NECAP scores and proficiency numbers, and compare them with the dollars it took to get those scores.  In order to do this we have to get rid of the silly NECAP convention of adding the grade level in the hundreds place of the scaled score, and just use the actual test score numbers which go from 0-80.  I don’t have budget numbers for all of the years that I have NECAP scores, so there are a few less years on these graphs than there were on the ones you saw with just NECAP results before.  And because we usually like to look at large numbers instead of lots of decimal points and zeroes all over the place, we will flip the ratio so that the output is on the bottom of the fraction.  This means that instead of points/dollar, we’re looking at dollars/point, and value goes up as the numbers go down.  With all of that in mind, here are the dollars per student-NECAP score numbers for Amherst School District from grades 3-8 for 2008-2012 in reading and math.  We get these by taking the $/student numbers and dividing them by the mean scores for each year.

Amherst School District spending per student  per NECAP test score for reading and math for grades 3-8.

Amherst School District spending per student per NECAP test score for reading and math for grades 3-8.

2009 was the year we had a one-time $2 million bump in the budget.  What we see here is that over time, in general, more dollars are required for every point scored in math and reading.  In other words, value is going down as the years go by.

We can look at these in a slightly different way.  Rather than the cost/point each year, we can look at the test scores and how much we spent per student in the teaching year.  It is the same idea as above, but now we don’t necessarily care which year it is, only what the spending per student number was that year.  Per-student total spending was gone over in a previous post if you want to look at those numbers and how we get them.

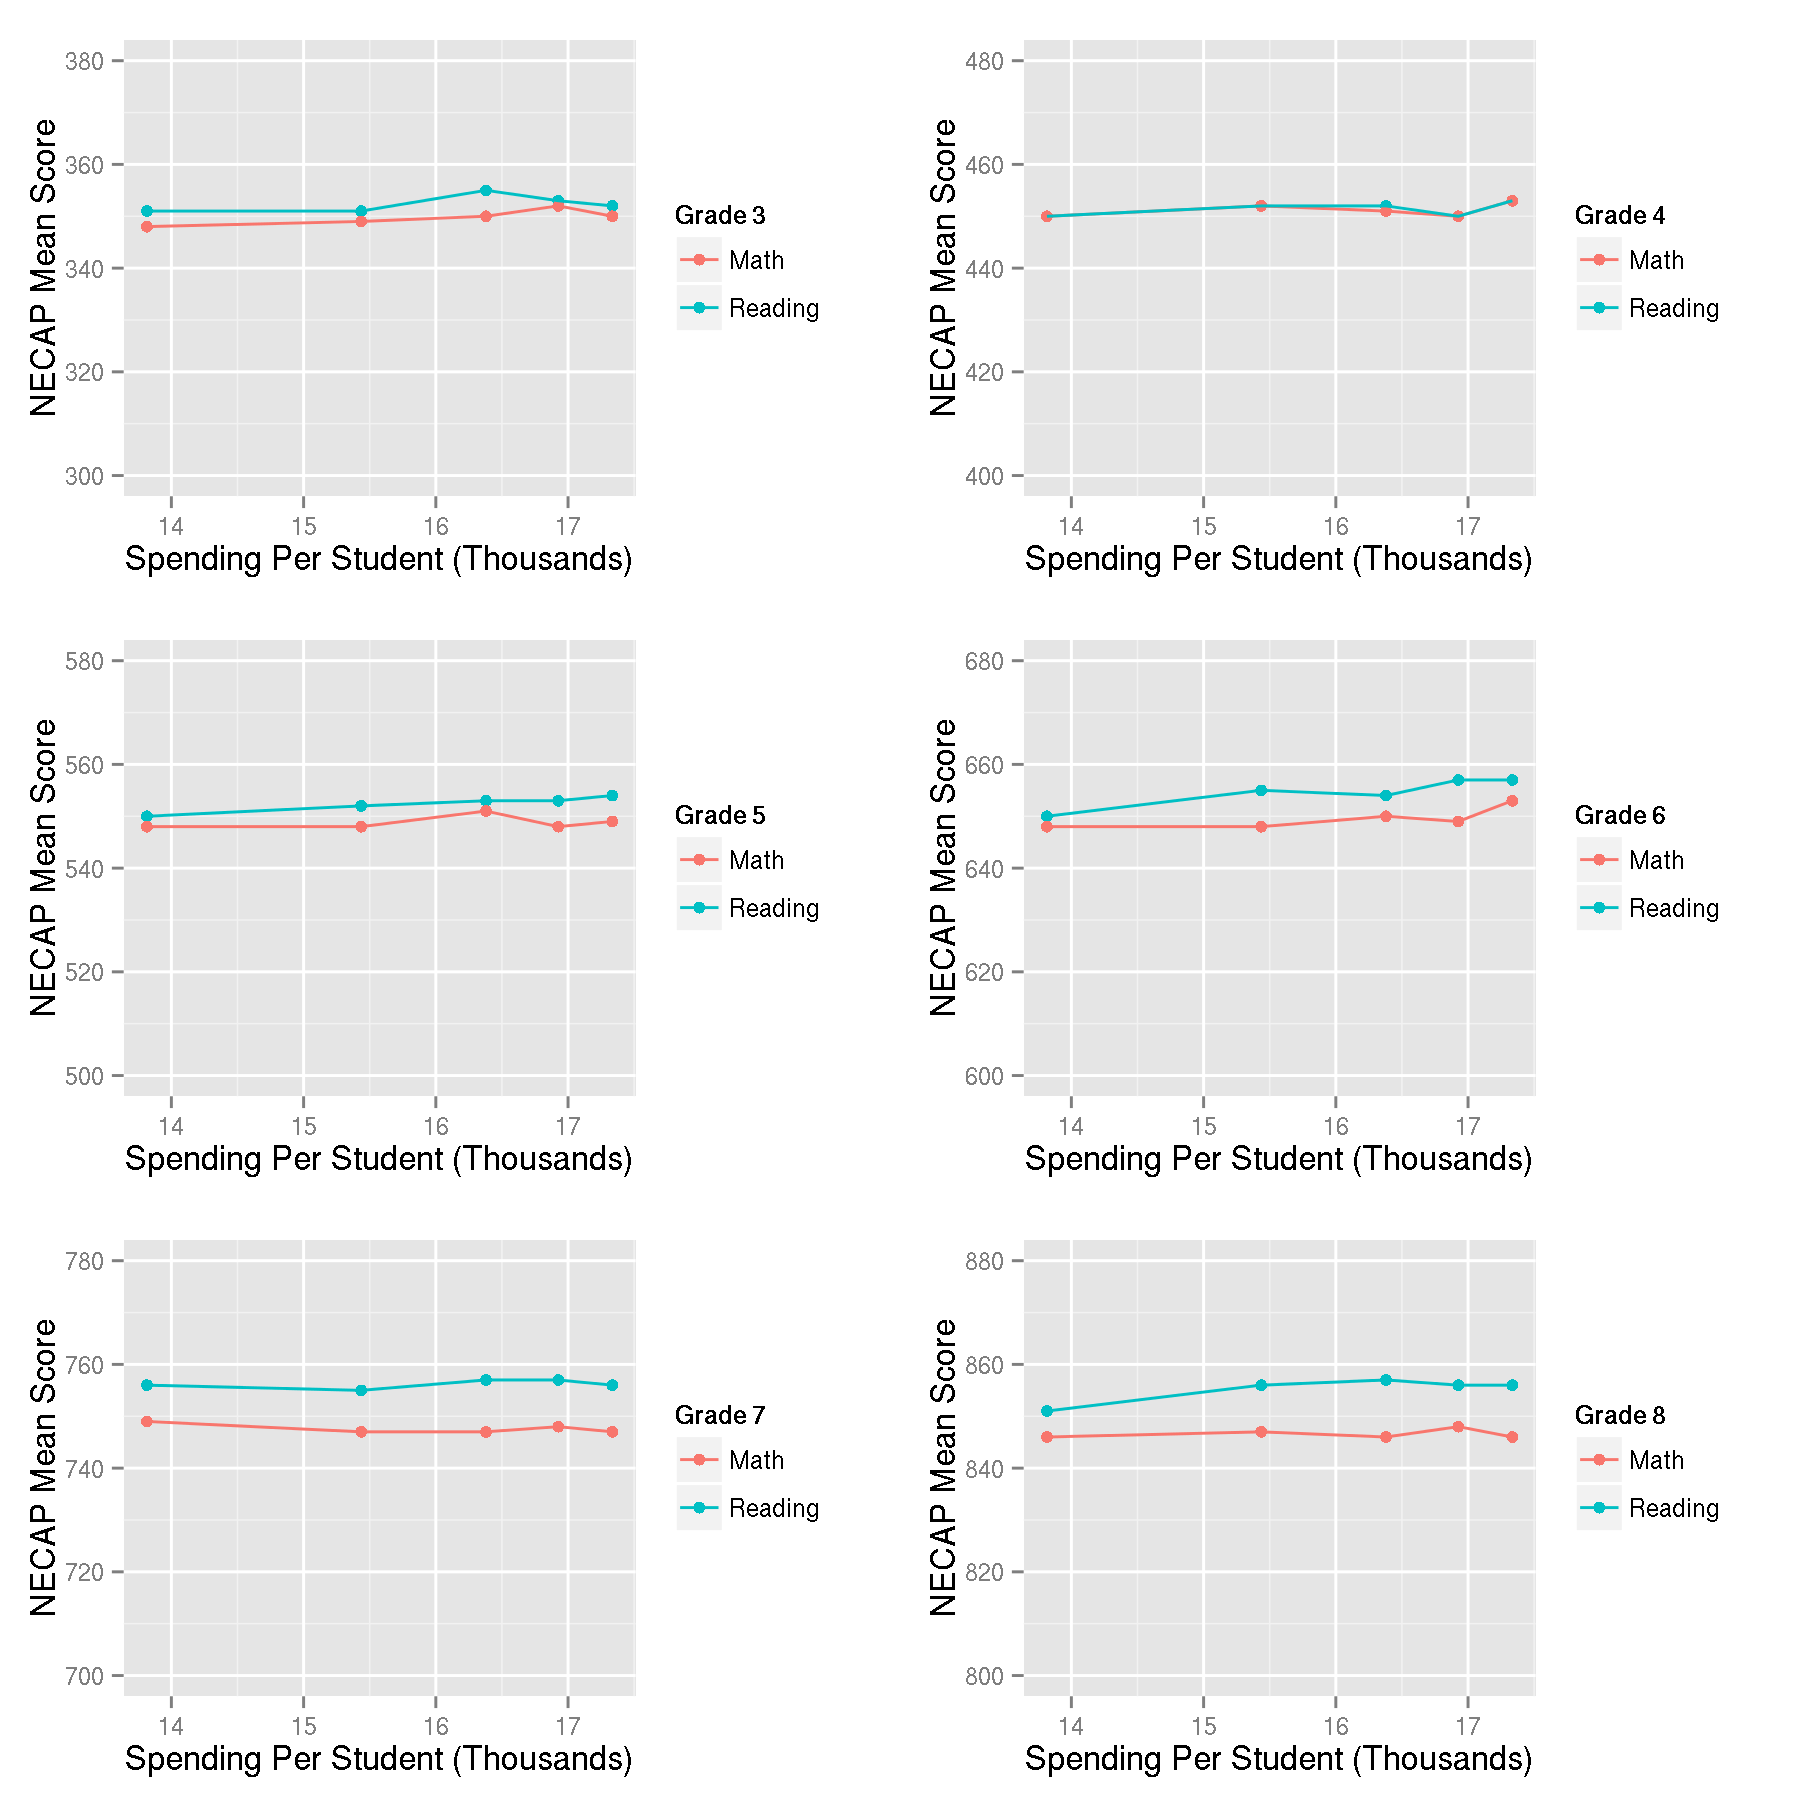
This look gives us a sort of price elasticity curve, if you’re familiar with economics.  That is, looking at the numbers this way we see how the amount of education changes as the cost of educating a student changes.  First the NECAP average scaled scores, grades 3-8, math and reading.

ASD NECAP Math and Reading score as a function of per student spending.

ASD NECAP Math and Reading score as a function of per student spending.

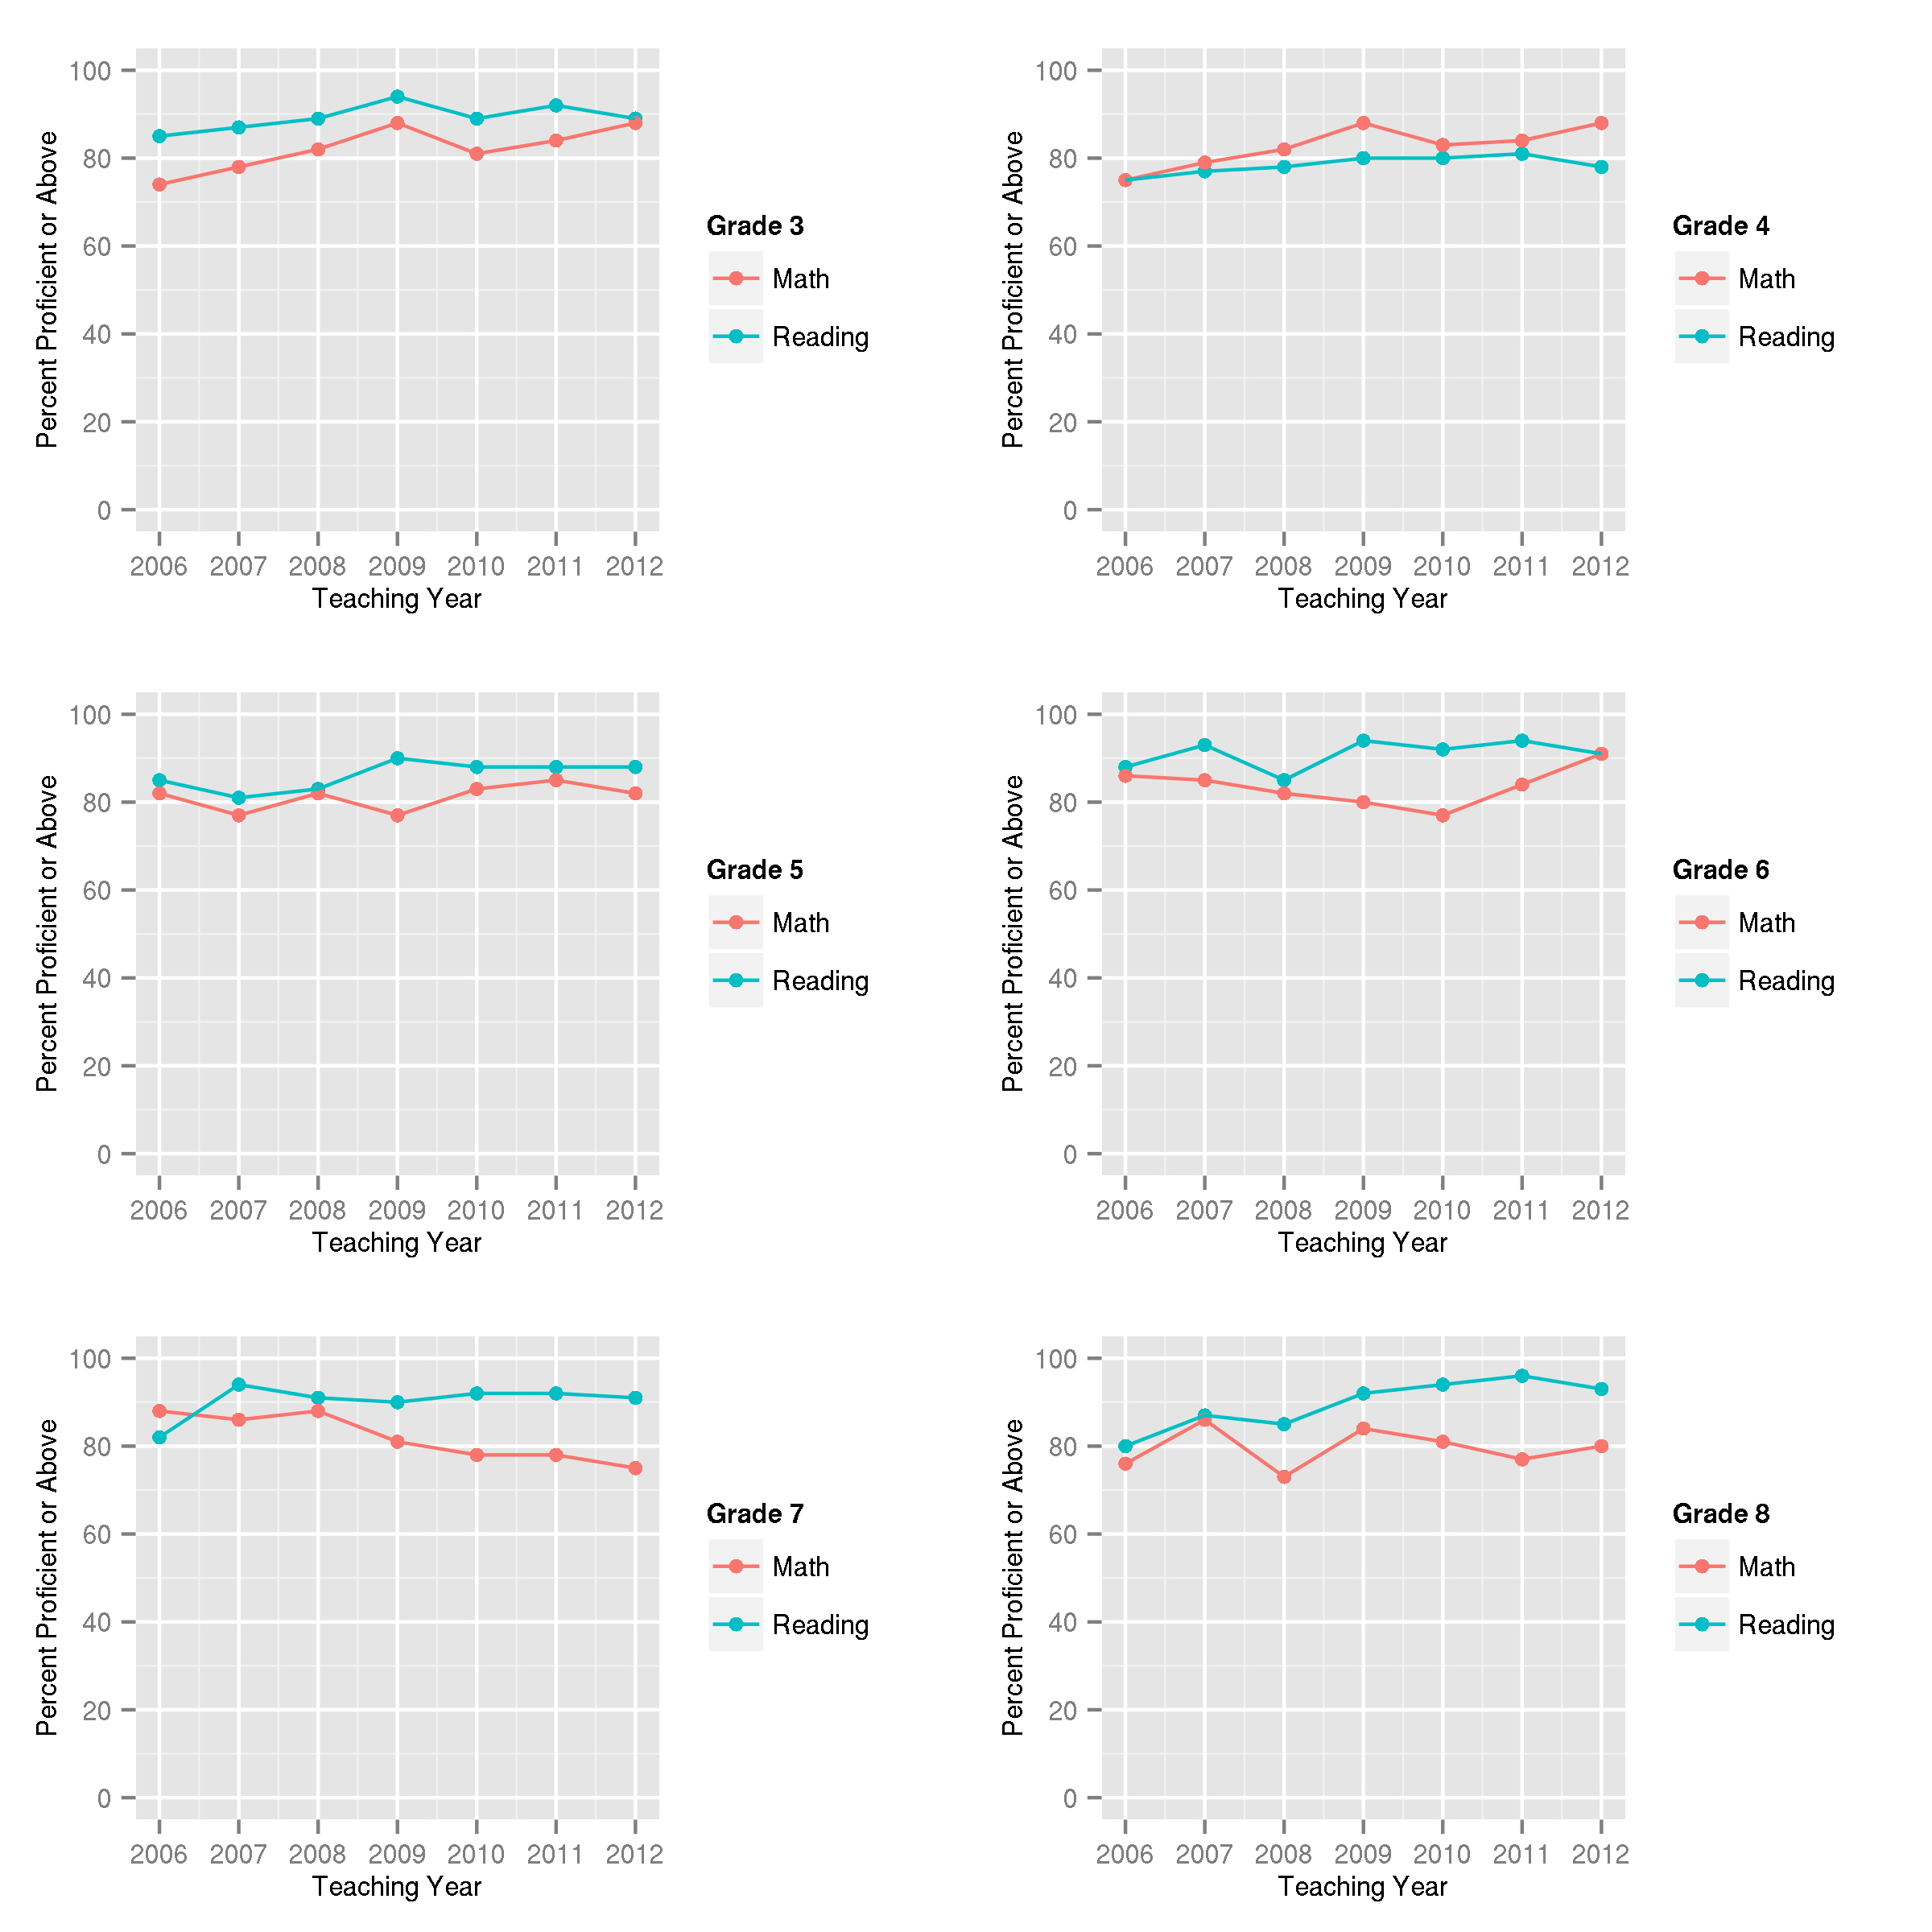
NECAP reading and math scores don’t seem to be very elastic. That is, they don’t change much regardless of how much money we spend.  What about the percentage of students who test proficient or above?

ASD NECAP student proficiency as a function of per student total spending.

ASD NECAP student proficiency as a function of per student total spending.

No matter how we look at the numbers, it is clear that the increases in spending haven’t given us any increase in educational value.

The key to understanding why this is so is to look at how the money was spent.  So we have to dig a little bit into the budget.

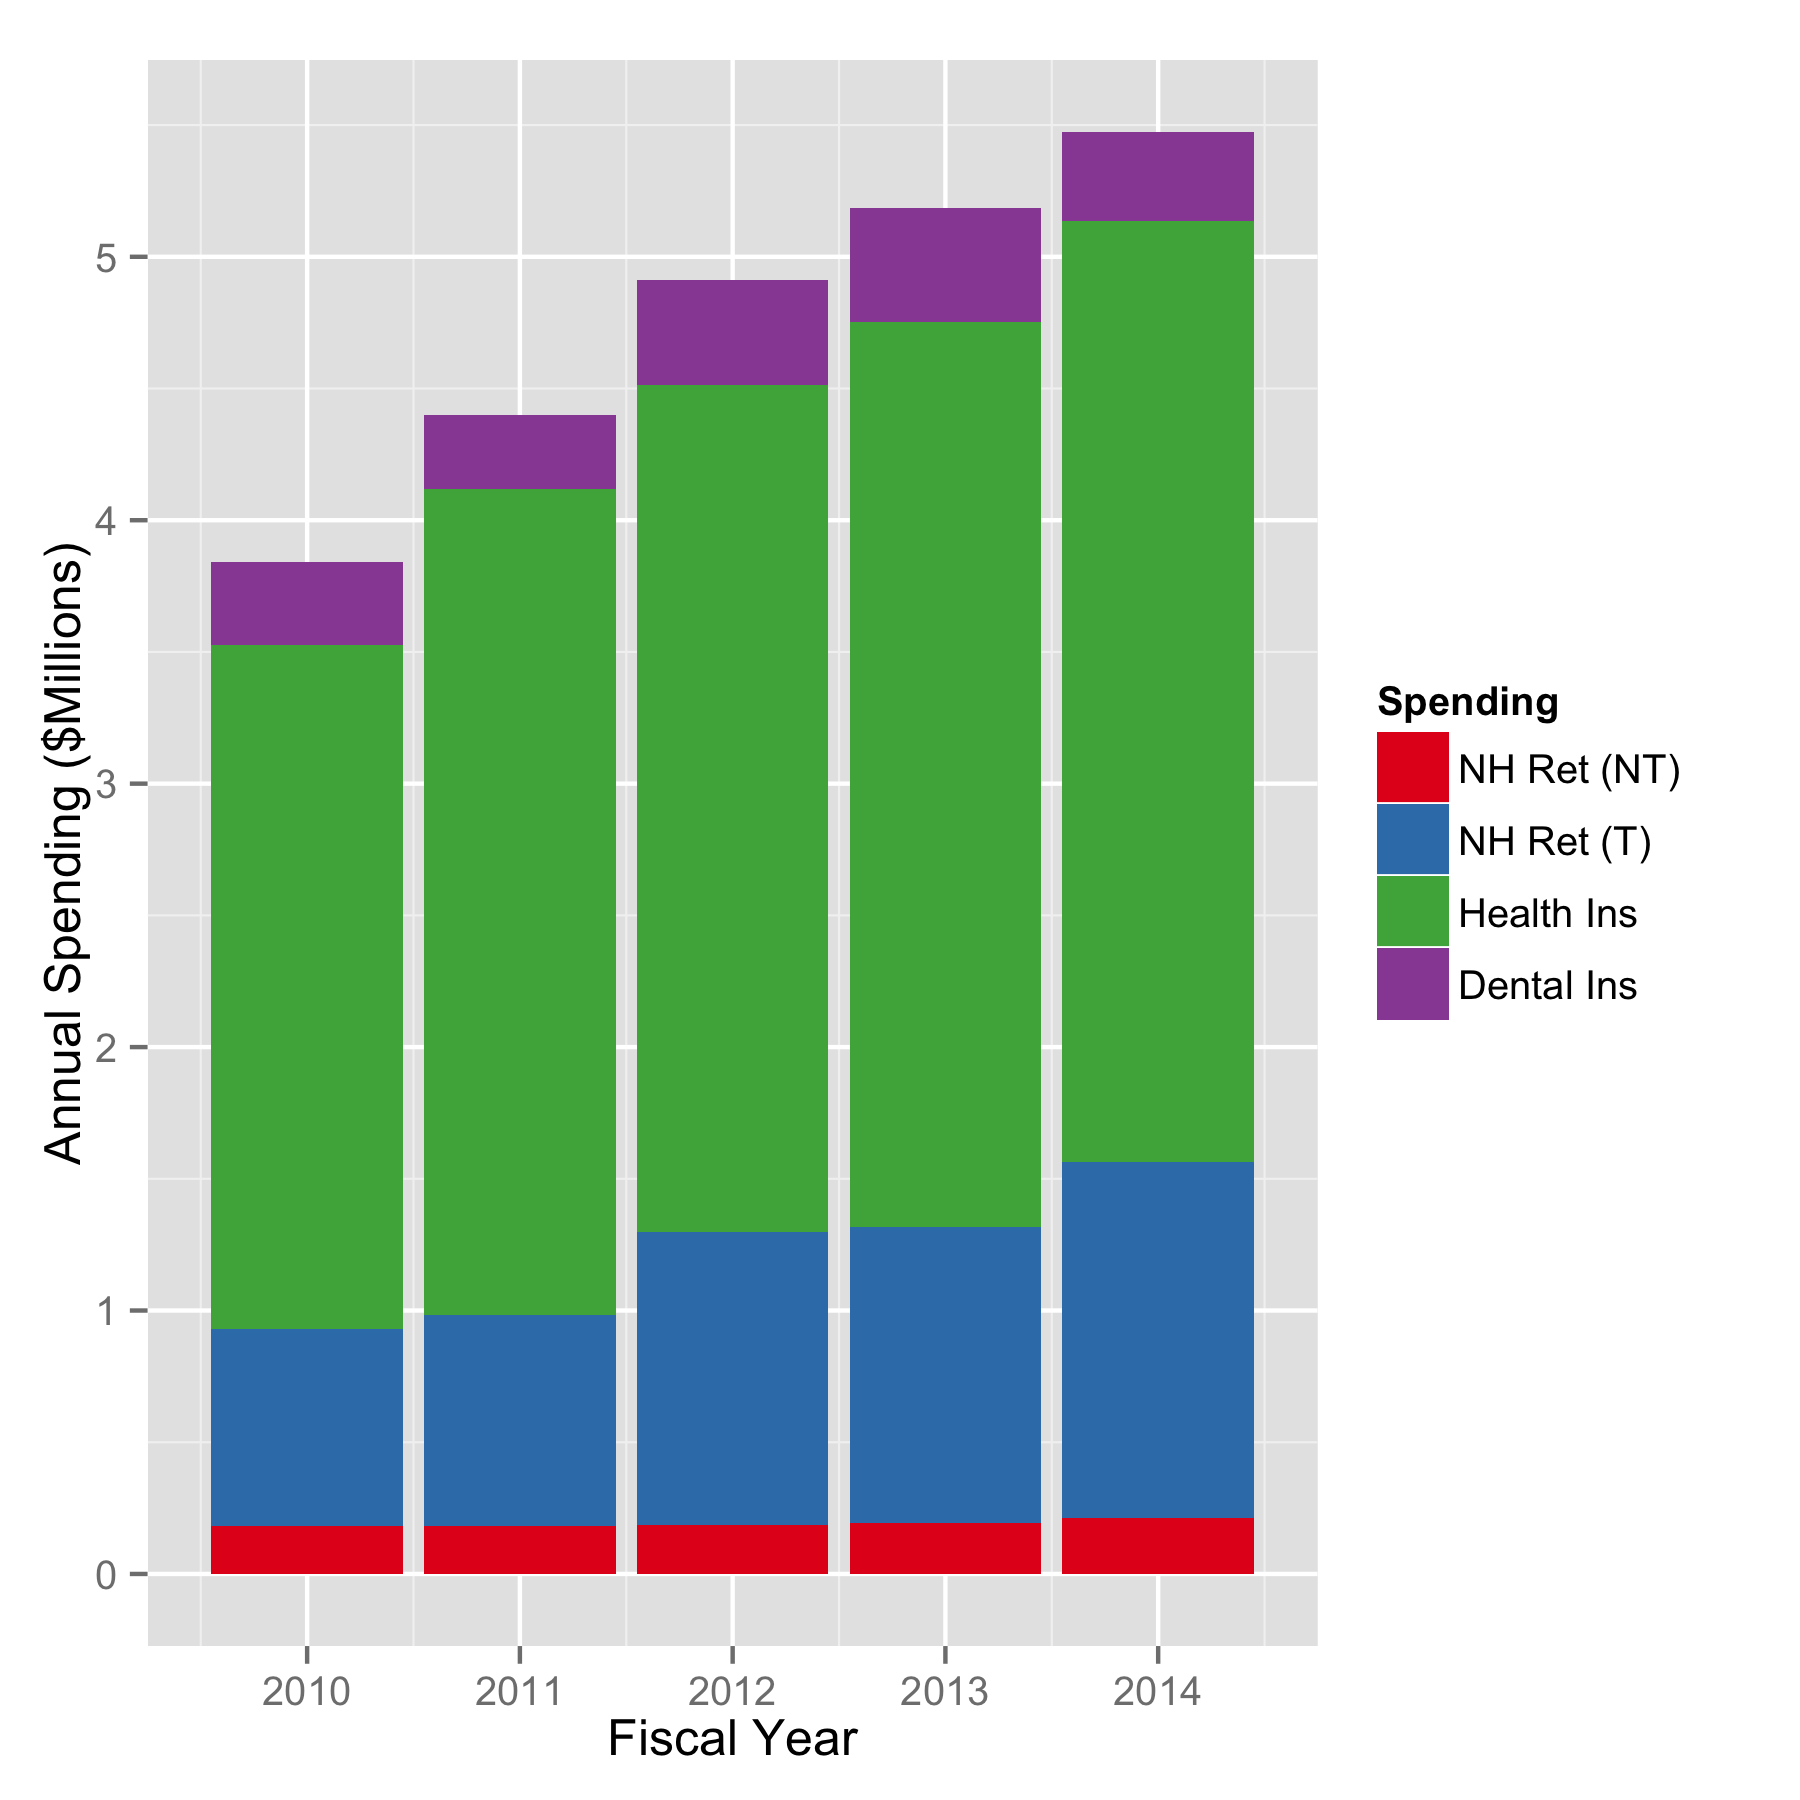
There is a good reason why the extra spending we do each year doesn’t give us a bump in education – it isn’t spent on education.  Since  2008, the average annual budget increase is $417k.  The average increase on insurance and NH Retirement is $395k.  That is, the spending increases each year go overwhelmingly into health insurance premiums and the NH Teachers Retirement fund.

Insurance and retirement costs for Amherst School District.  The major drivers here are health insurance and the contributions to the New Hampshire Retirement System for teachers.

Insurance and retirement costs for Amherst School District.

What this means to me is that the top priority this year is to get control over these costs.  I am certain that the school board and the administration have plenty of programs they would like to implement, but can’t because of budget constraints.  I know from talking with people in town that they want tax relief.  Making this happen will take creativity and leadership.  I have high hopes that we are up to the challenge.

Amherst School District – Value and Trends in Standardized Testing (Part 1)

Before I changed my college major to Physics, I studied Electrical Engineering.  One of the ways electrical engineers look at complex circuits is to replace them with imaginary black boxes.  They can then measure what goes into the black box (inputs), and also what comes out of it (outputs), and from those measurements they can learn how the black box behaves without knowing too much about the details of what goes on inside of it.  This sort of approach can be useful in understanding the behavior of other complicated systems, school districts included.

We spend a lot of time evaluating things like budgets, staffing, and enrollment for the district – these are all inputs.  We can analyze spending areas and benefit costs over time, but these are just detailed views of some parts of these inputs.  What we haven’t looked at yet are outputs, and they are overdue for some attention.

So what are the outputs of a school district?  Different people will have different answers to this question.  For me, I’m going to say “educated students” as that is the reason the district was created – to educate the children of Amherst.  Measuring the level of education is an important, but complicated task.  Few professional educators I know can agree on a satisfactory way to measure it, and there are plenty of disagreements on what the measurements that are made actually mean.

But we shouldn’t let the lack of a perfect measurement stop us from making any measurements at all, and we should look very closely at the ones that we can make, or in this case, already have been making.  At the beginning of each school year, the New England Common Assessment Program, or NECAP, tests are given to children in grades 3-8 for reading and for math.  There are some other subject tests given, but not to all grades each year. The results of these tests for Amherst School District are posted on the New Hampshire Department of Education website (see the NECAP Longitudinal Reports section toward the bottom of the page).  There you will find the percentage of students that score proficient or above in each subject, and also the average scaled scores, both of these for each grade level tested.  Now if you’ve been following along with anything else on this website, you know that I’m about to show them to you.

Below are the individual grade level NECAP testing results for math and reading for teaching years 2006 through 2012.  Plotted first are the percentage of students scoring proficient or above for grades 3-8.  (Note:  The NECAP test for teaching year 2006 is given in the Fall of 2007, etc.)

Amherst School District NECAP data for math and reading.  Scores are reported for teaching year.

Amherst School District NECAP proficiency data for math and reading. Scores are reported for teaching year by grade.

Apart from the steady decline in the percentage of 7th graders testing proficient in math, nothing really jumps out here.  That is the problem.  Can you pick out the year we hired the literacy coaches from the reading results?  How about year we started with math coaches? I’ll admit that I’m having trouble figuring those out myself.

Perhaps we will have better luck looking at the average test score numbers.  So here they are broken down by grade, same style as above.  NECAP has an odd scoring system.  The scores are created by adding the grade level in the hundreds place, plus a numeric score that ranges from 0 to 80.  This strikes me as a very poor way to represent test scores, but here they are on comparable scales.

NECAP average scores for Amherst School District.  These are the mean scaled scores each year by grade.

Amherst School District NECAP average scaled scores for math and reading. Scores are reported for teaching year by grade.

Similar to the proficiency percentages we looked at before, there are a few years with some modest gains, but there are some modest losses as well.  What is quite clear is that since teaching year 2006 we have seen no significant improvement in reading or math standardized test scores, or the proficiency percentage of students tested.  Now would you be surprised to find out that we’ve added about $4 million to the Amherst School District annual budget in this amount of time (i.e. going from about 20 up to 24 million)?  This is where the question of value comes in.

There may or may not be better ways than NECAP to measure individual student performance, but that is an issue for a different time.  Standardized tests are generally accepted to be a reasonable way to make year-to-year comparisons for establishing progress on a broader scale.  And I think the numbers speak for themselves that we have room for improvement in the district.  It is reasonable to guess that this was the goal behind starting our teaching coaches program.  Now I don’t want to sound like I’m picking on teaching coaches, but it is not clear that this experiment has paid off.  Rather, it looks to me quite the opposite.

I should point out that last year during the Ways and Means budget meetings, I asked the director of curriculum development about metrics demonstrating the effectiveness of the coaching program.  I was told they did not have them, but that they had a plan to get them (though the time scale was not clear).  Now consider that in the school year starting this Fall we will spend $435,000 (salaries + benefits, etc.) on teaching coaches in Amherst School District alone.  Literally millions of Amherst taxpayer dollars have been spent on the coaches program since it was started, and without any discernible impact on measured education levels in either math or reading.  That is enough to make me question the value the teaching coaches program has brought to the students or to the taxpayers of Amherst.