I spent some time at the Department of Public Works here in Amherst looking at the remaining lots (unsold) in Meadowview Cemetery. I wanted to be able to make a calculation of how many years of usage are remaining at Meadowview as a double check on what the Cemetery Trustees have said. It turns out that we have the capacity for 661 burials left at Meadowview Cemetery. Here’s the breakdown:
| Lot Type | Number of Lots | Burial Capacity |
| Single Lots: | 66 | 66 |
| Double Lots: | 225 | 450 |
| Triple Lots: | 27 | 81 |
| Quadruple Lots: | 16 | 64 |
| Total Capacity: | 661 |
To answer the question of how many years until the cemetery is full, we have to consider a few things – how many burials we make per year, and how many of those burials require a new lot. This is because people can purchase lots today for usage in the future, and those lots make up the majority of the ones used for burials. So let’s go back over our burial rate in Amherst cemeteries. Over the last 80 years, the average burial rate is 22/year, plus or minus 6. We have seen this here before. Remember that the current year’s number is not for the full year.
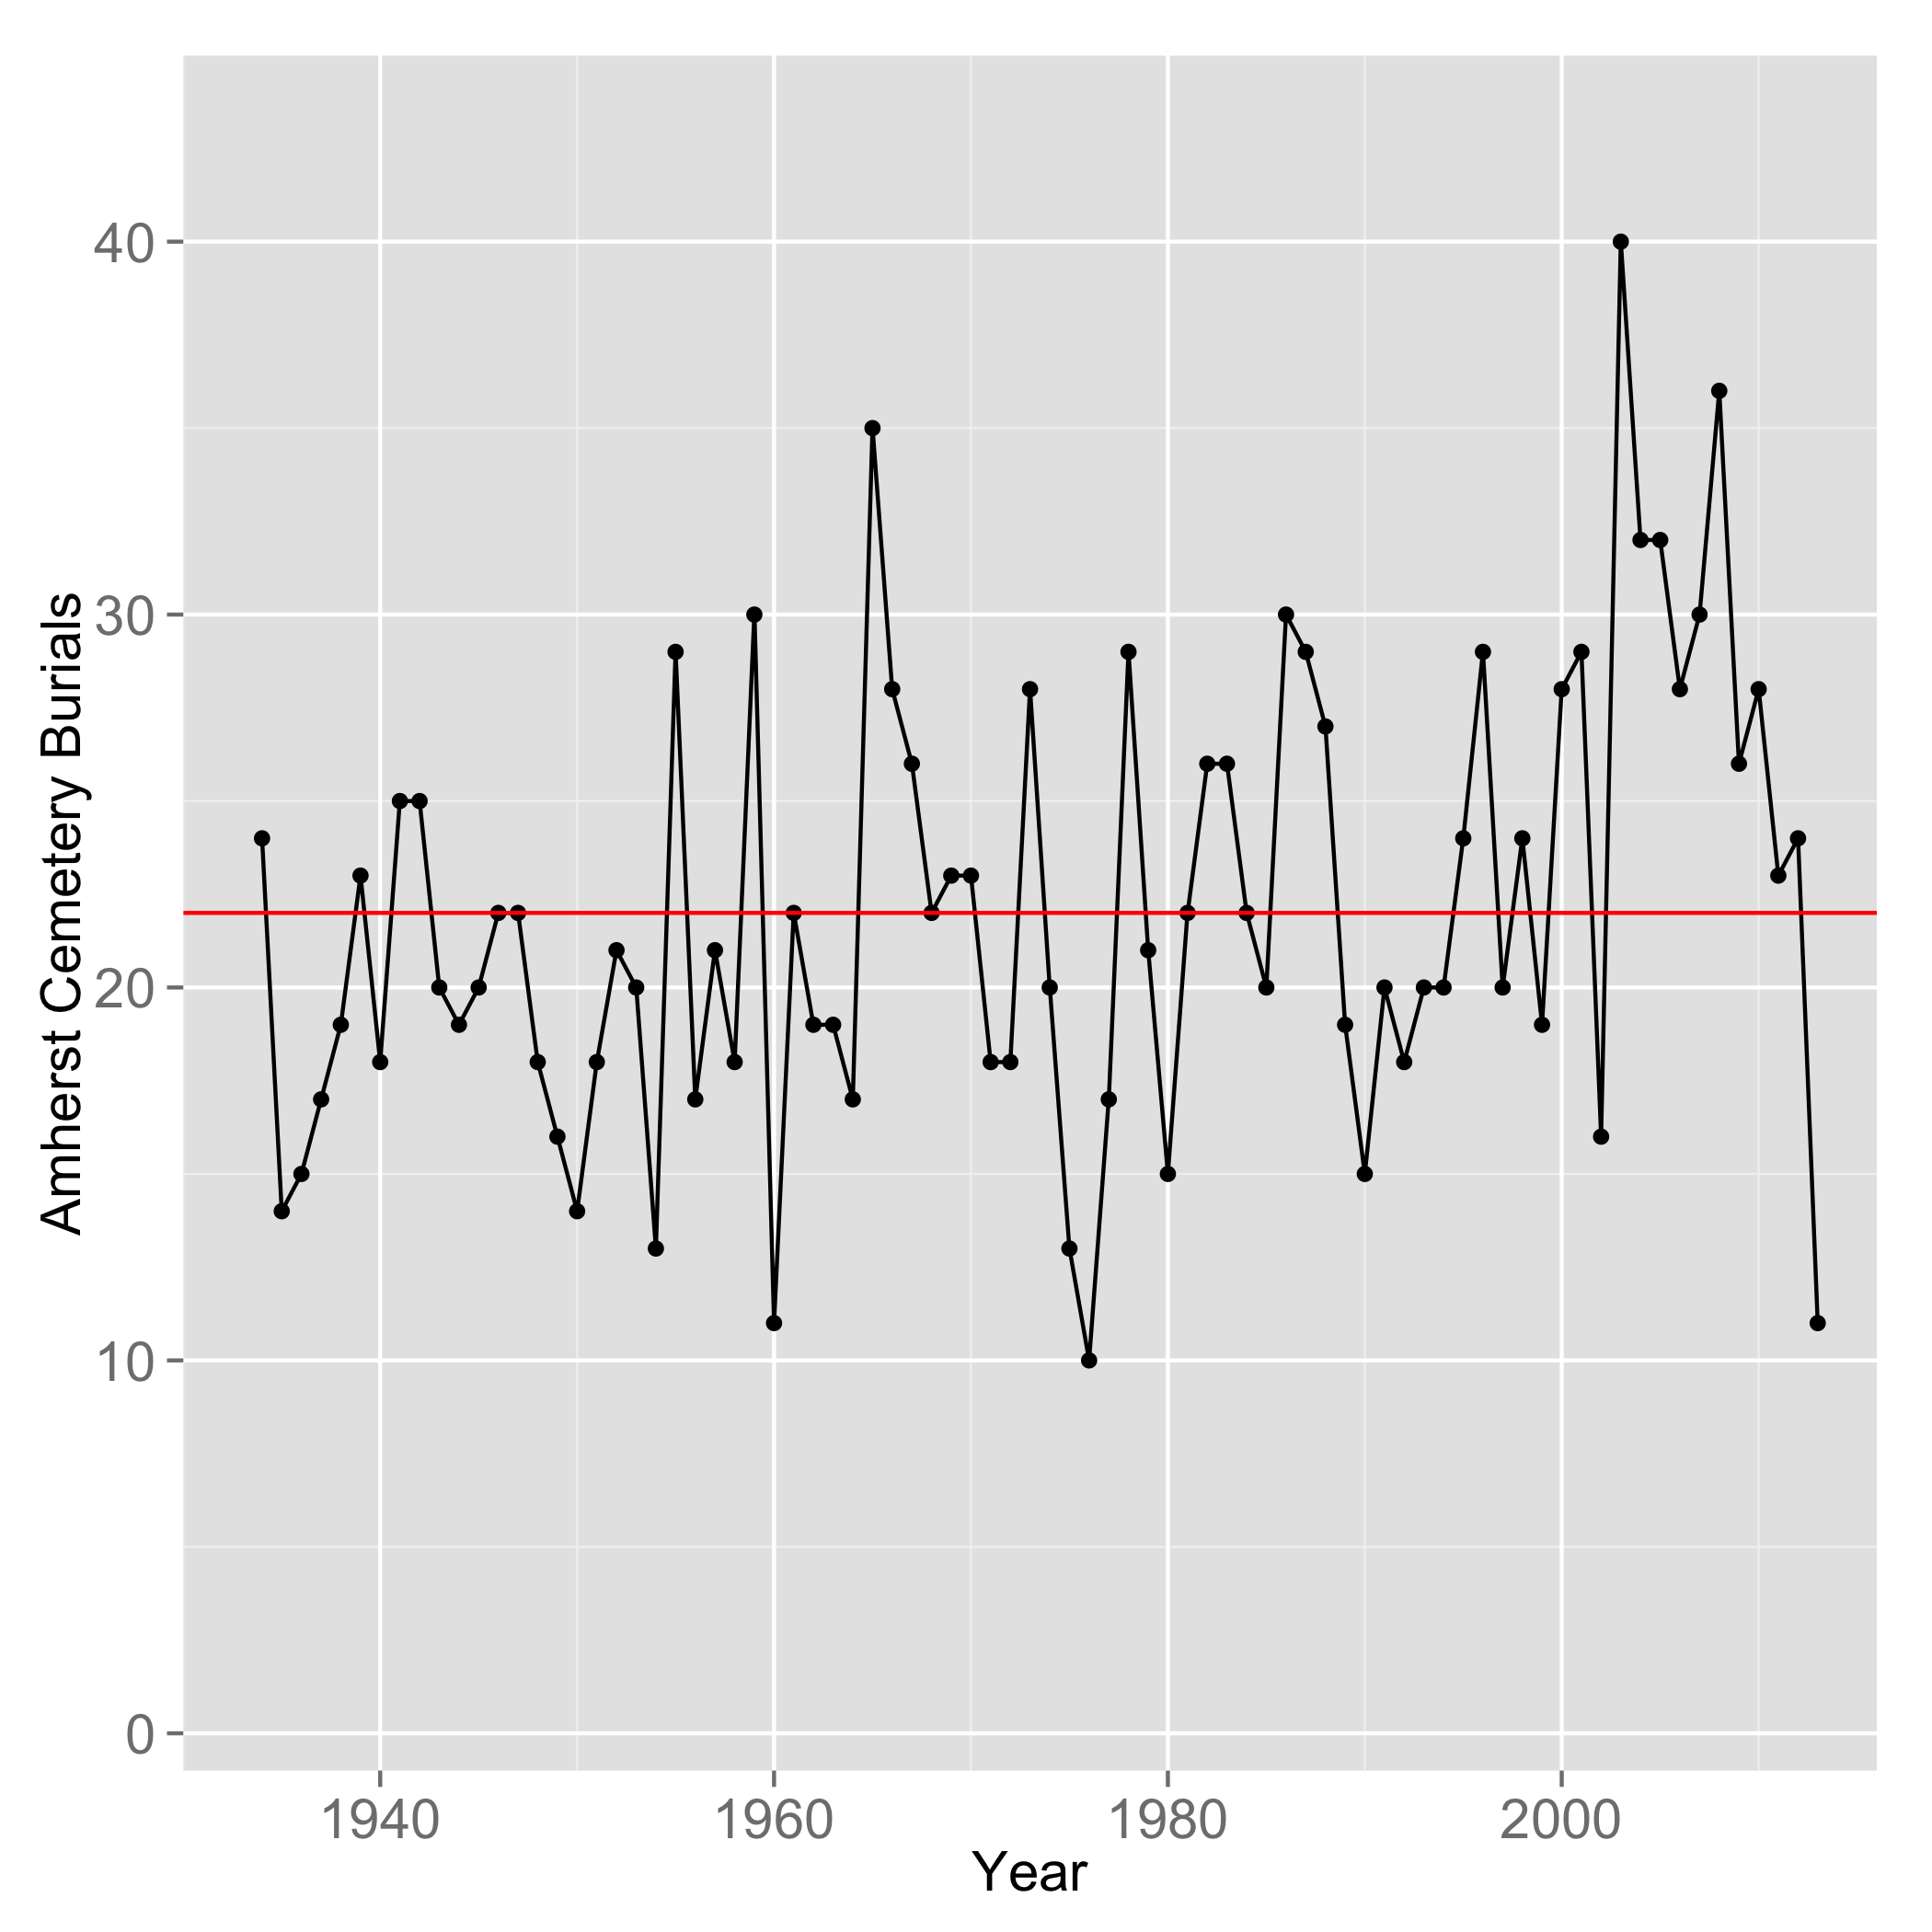
Annual number of burials in Amherst, NH cemeteries. Data from Department of Public Works records.
And we have numbers for lot sales, though unfortunately not for the same range of years. To make this simpler, we will just look at the percentage of burials using previously purchased (perpetual care) lots here. The most recent number is around 60%. The details on where these come from is here.
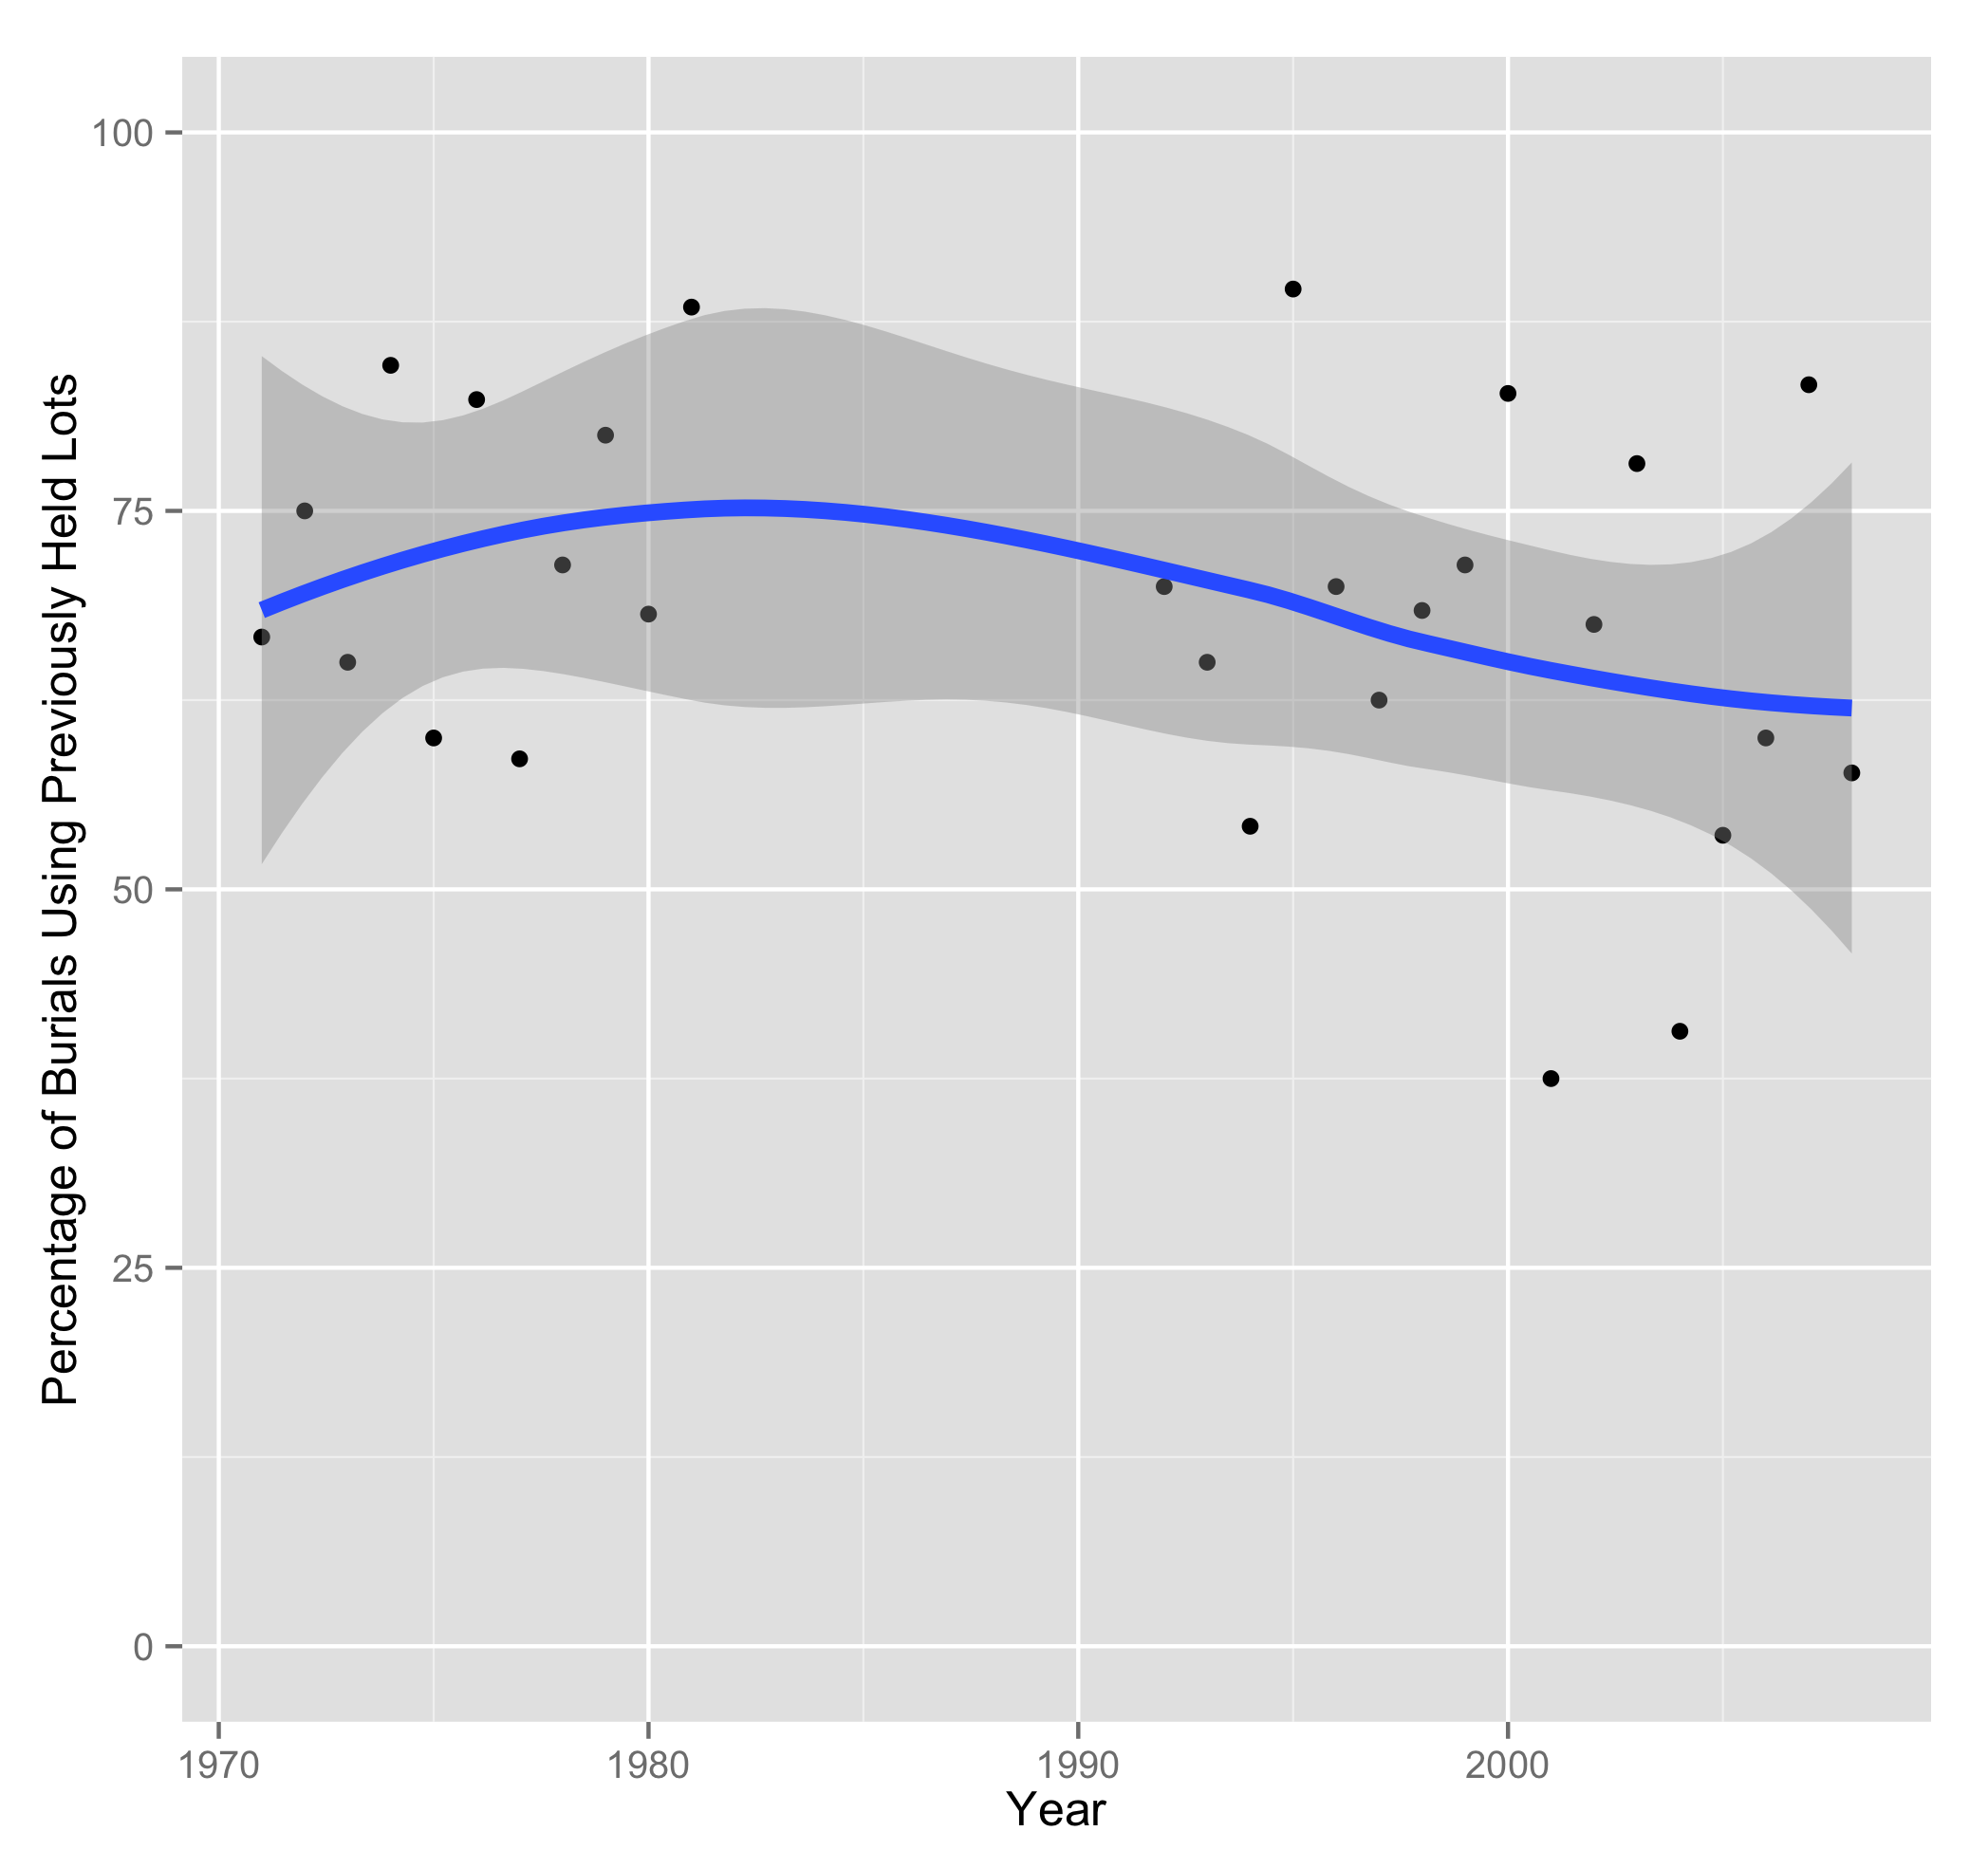
Percentage of Amherst cemetery burials using previously held (perpetual care) lots.
So now we have what we need to know. Let’s do the “most likely” analysis using the 80 year average burial rate (22/year) and the 60% number for perpetual care lot usage from the graph above. That means 40% of the burials require new lots taken away from the 661 we have today. So how long will it take until Meadowview is full? Answer: 75 years.
| Current Lot Inventory: | 661 |
| Burials/year: | 22 |
| Percentage using newly purchased lots: | 40 |
| New Lot Purchases/year: | 8.8 |
| Previously Sold Lot Usages/year: | 13.2 |
| Time to exhaust inventory (years): | 75.1 |
Let’s take a “worse case” scenario and use the 28/year burial rate (22+6) and the same new/perpetual care split. How many years are left at Meadowview then? Answer: 59 years.
| Current Lot Inventory: | 661 |
| Burials/year: | 28 |
| Percentage using newly purchased lots: | 40 |
| New Lot Purchases/year: | 11.2 |
| Previously Sold Lot Usages/year: | 16.8 |
| Time to exhaust inventory (years): | 59.0 |
Obviously these hold so long as past trends continue into the future. Who knows if or when our increase in population may eventually start to show in our burial rates. But notice that it hasn’t for 80 years. And we have no idea how many perpetual care lots are left to be used, because no one really keeps track of that specifically. So let’s take this one step further and imagine there are no perpetual care lots left to use, and we use our statistical high rate of 28 burials/year rate, all of which take up a previously unsold lot. This would be our “worst case” scenario. How long then? Answer: 23 years.
| Current Lot Inventory: | 661 |
| Burials/year: | 28 |
| Percentage using newly purchased lots: | 100 |
| New Lot Purchases/year: | 28 |
| Previously Sold Lot Usages/year: | 0 |
| Time to exhaust inventory (years): | 23.6 |


