When it comes to understanding how we use our cemeteries in Amherst, something was still missing in my mind after going through the population growth in town, the annual burial numbers in our cemeteries, and also the cemetery lot sales numbers. To quickly review, since 1934, on average, we have a flat average of just 22 burials per year (+/- 6) in Amherst, NH cemeteries (see below). The lot sales numbers indicate that we sell on average less than 8 cemetery lots per year (between 1971-2008), indicating that most of the burials are in lots that have been previously purchased (perpetual care lots).
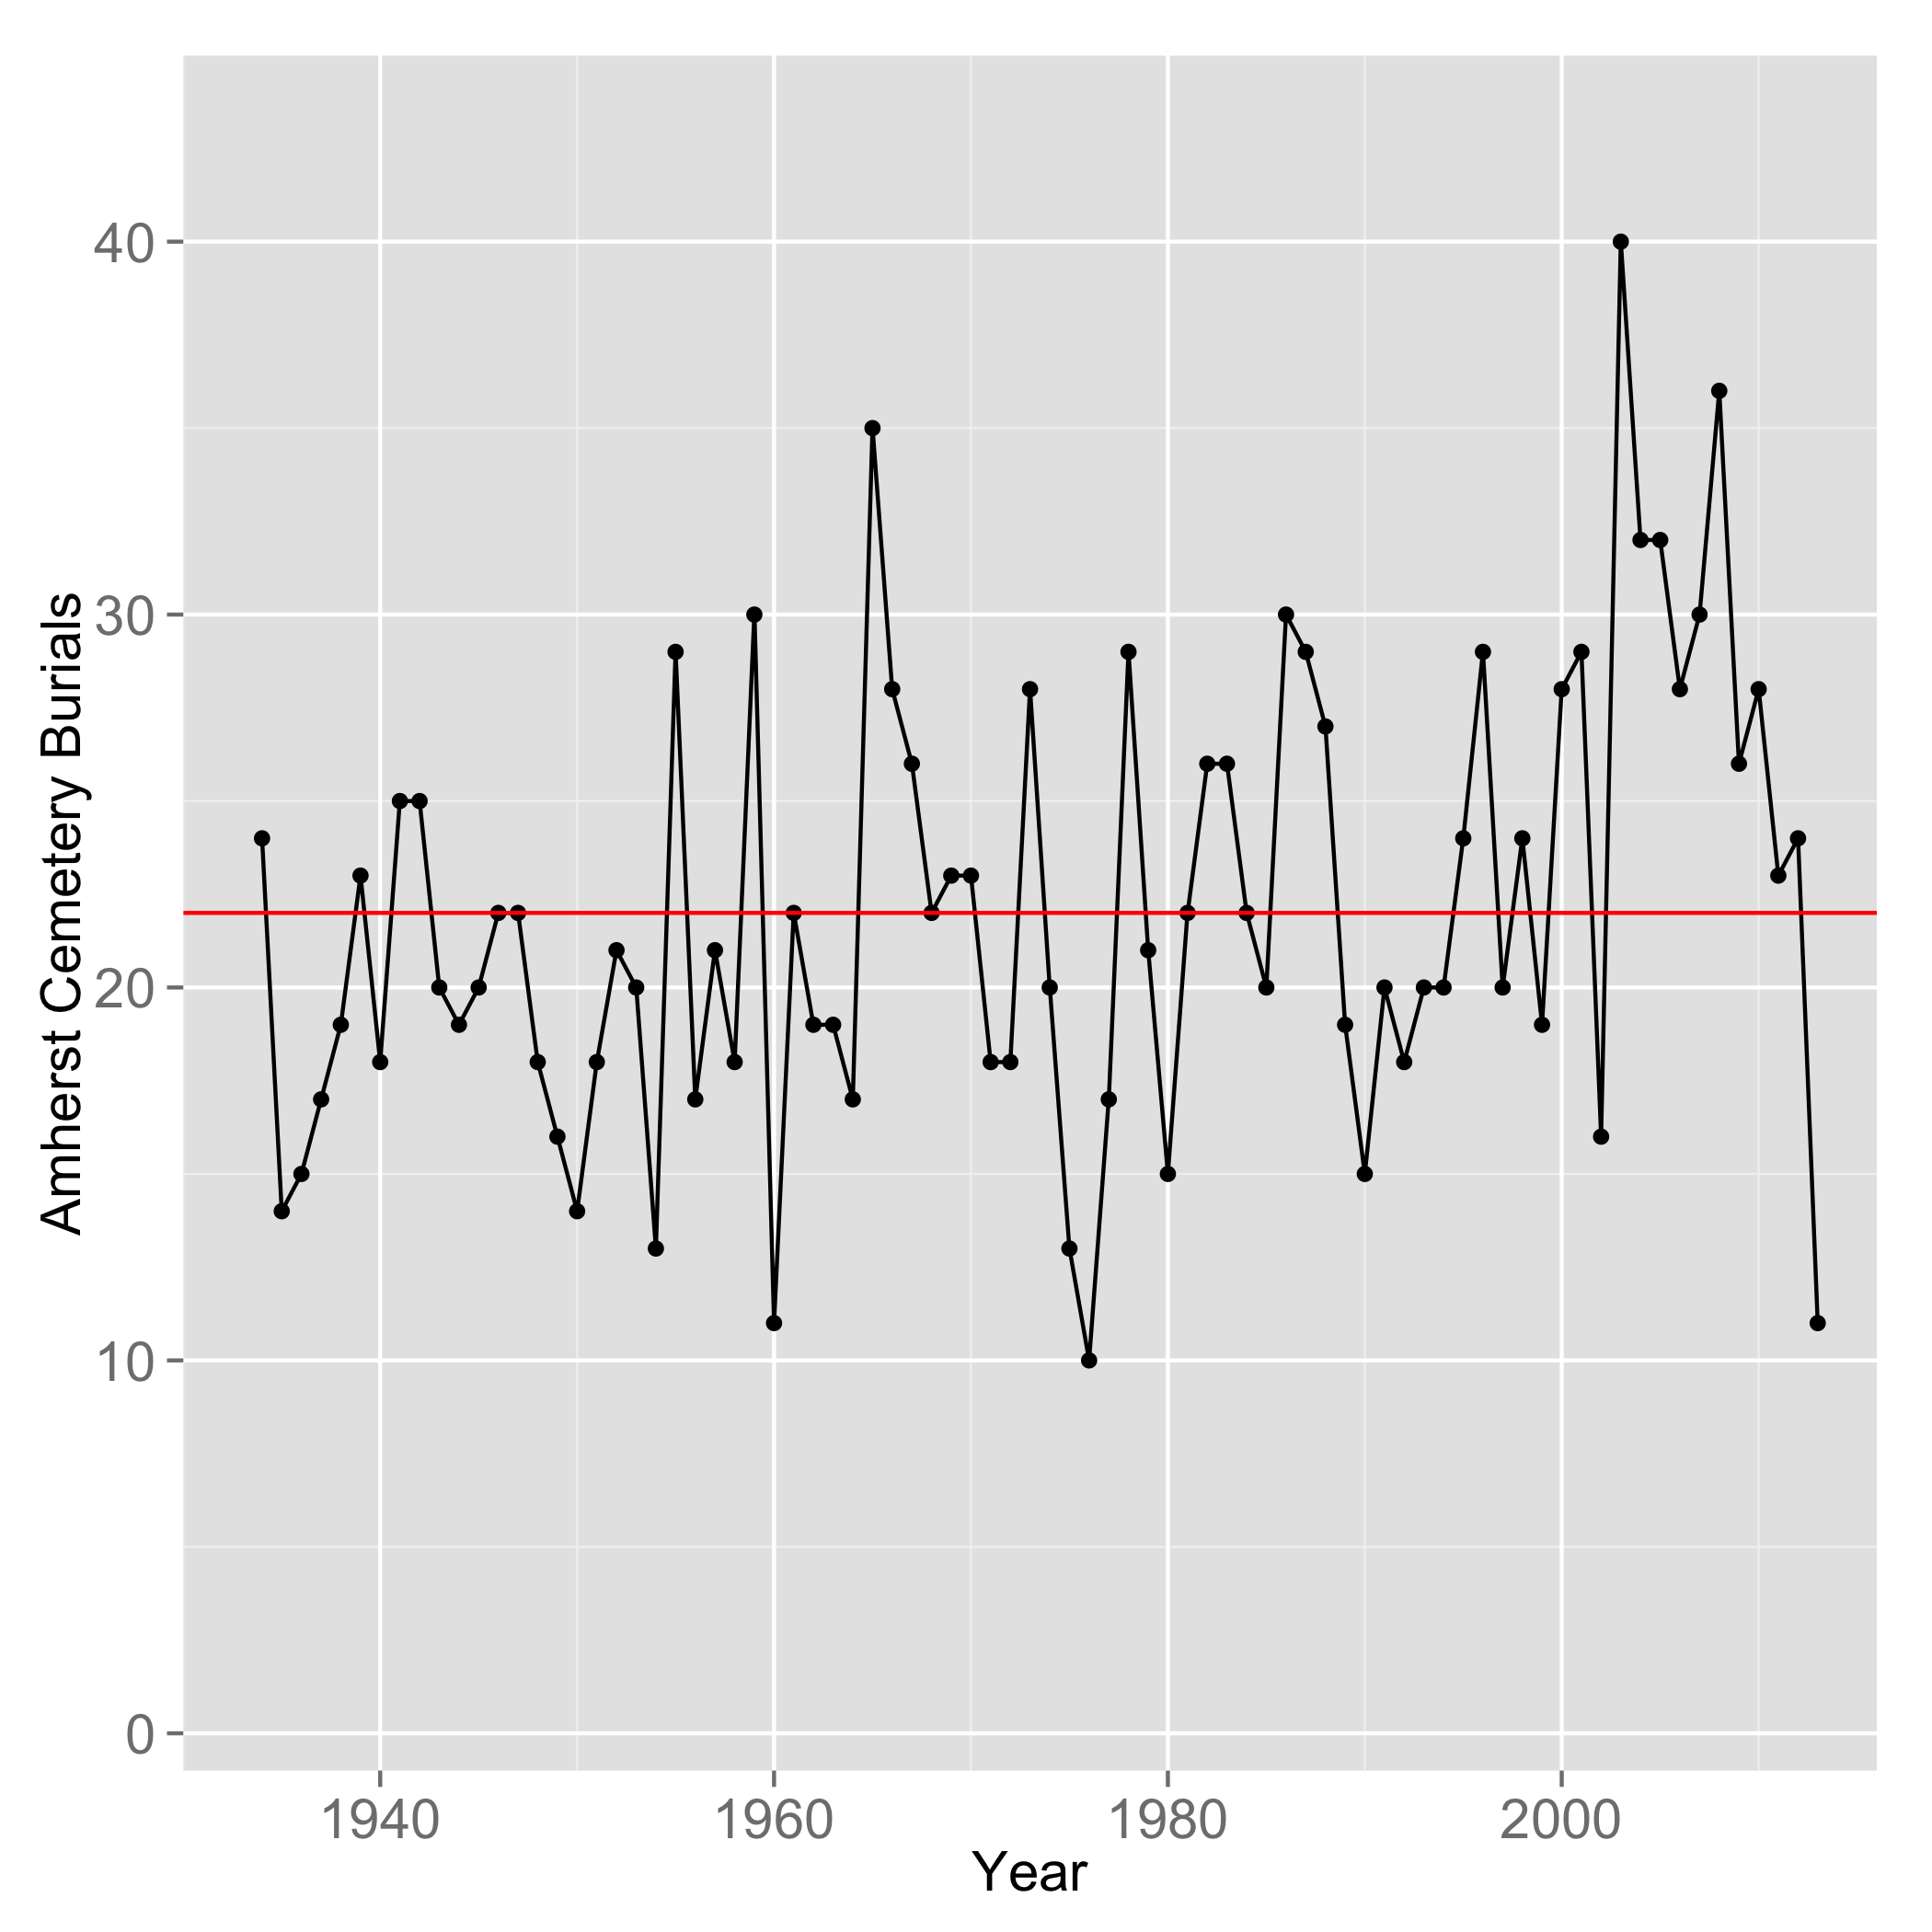
Annual number of burials in Amherst, NH cemeteries. Data from Department of Public Works records. The red line shows the average value of 22.
This is rather surprising in light of the town’s population growth in that time. As per the US Census, we have gone from about 1000 people in Amherst to over 11,000 in that amount of time (see below). So the conundrum is that even though there are 11 times more of us here now than there were 8 decades ago, the number interred in our cemeteries each year hasn’t changed. At all.

US Census data for the town of Amherst, NH.
This doesn’t make a whole lot of sense, but the numbers are all real. Something to ponder while we press on.
One missing piece of this puzzle is the number of Amherst residents who die every year. Now you might guess that the number of residents who die and the number of people who are buried here would be basically the same. This would make sense, but this would be wrong. The number of resident deaths in Amherst is tabulated and reported every year in the annual town reports, which are available in the town library’s archive room, and that is where I obtained the numbers (graphed below). These are still remarkably small numbers, though they do show a slow growth trend, tripling in 8 decades.

Amherst Resident Deaths from 1934 to 2012, as recorded in Annual Town Reports. The blue line shows the running average.
So here is the conundrum now, since 1934 the population of Amherst has increased by a factor of 11, the number of annual resident deaths have gone up by a factor of 3, and despite those increases, the burial rate has not changed.
There’s a twist to this story, we just haven’t seen it yet. It is difficult to plot resident deaths the same graph with the burial numbers for comparison, but we do need to compare them. So instead let’s look the ratio of burials to deaths. This will be a much more useful graph. Plotted here (see below) is our annual Amherst cemetery burials as a percentage of Amherst resident deaths each year. There is something quite surprising going on, do you see it?

Burials in Amherst, NH cemeteries as a percentage of Amherst resident deaths. The unlikely percentages are caused by the “brought from away and buried in Amherst” burials.
It turns out that it has been quite common for people to be “brought from away and buried in Amherst.” In some years those numbers have exceeded the numbers of Amherst residents who died. When that happens, we get some statistically very unlikely burial percentages, which you see above. Now why people would be brought in for burial is a question for the historians. But up until ten years ago or so, these “brought from away” numbers were in the town reports. Whether or not this is still going on is an unanswered question at this point, and we have no information on the number “sent away” for burial.
One thing that is readily discernible here is that the percentage of dead which are buried is decreasing. Let’s assume for a moment that the number of “brought from away” burials is currently the same as those who are sent away. If this is true, the 2012 numbers show that about 50% of our residents who die are not buried. Now if the number “brought from away” is greater than those sent away, as it must have been for many years, this fraction of residents not buried increases. So what happens to the 50%+ who aren’t buried?
The answer, I believe, is cremation, an increasingly popular alternative to burial in this part of the country. That explanation is consistent with the numbers that are reported here, and also with funeral homes reports in the area, which report that more than 60% are choosing cremation over burial. The numbers from Amherst here are somewhat muddied by the fact that the head of DPW tells me that cremated remains are sometimes buried, requiring a lot and being recorded as a burial, so cremation rates in town are greater than what would be suggested here by burial numbers alone.
Now I think we have a reasonably complete picture of how we use our cemeteries in Amherst. A useful thing to know for planning purposes would be the numbers of unsold and perpetual care (sold but unused) lots currently in town cemeteries. We could use these, along with what we know from historic numbers, to forecast the number of years left before new cemetery space is required.
