One of the issues that I hear often in talking with people in town is about how much our taxes in Amherst have gone up in recent years. So it made sense to me to dig deeper into this issue to better understand what has been taking place and put some numbers on it.
Lucky enough, the information that we’re after is collected by the state and made available online. The tax rate graph for Amherst below shows that the largest property tax impact in our town budget comes from the cost of operating our schools. This is not uncommon in New Hampshire where we’re largely on the hook for costs of what we do in our towns. Since they are the biggest piece of the tax pie and since I’m chairing the Ways and Means committee for the Amherst School District this year, let’s start with education taxes.

Amherst tax rates by fiscal year.
Before we get too far into what these numbers mean, I think it makes sense to put our numbers in perspective, so I gathered information for Bedford and Merrimack as well as for Amherst. Interestingly, the state does not split the Amherst School District and Amherst’s share of the Souhegan Cooperative School District apart, so the Amherst numbers that we will go over here are our complete numbers for the town’s education costs.
So let’s start by looking at local education property tax rates. Below are the mil rates (tax rate per $1000 of property valuation) for education in the three towns since fiscal year 2001. Note that the rates jump all over the place, particularly for Amherst. This requires some explanation.

Local tax rates for Amherst, Bedford, and Merrimack.
There’s a very good, but slightly odd, reason for these jumpy numbers. This tax rate is calculated by first determining the amount of money that needs to be raised from the budget and then dividing that number into the total value of taxable property in town. Take away a factor of 1000 and you get your mil rate. Now every few years the town pays for an assessment of property in the town. Either the people who do the assessments have some interesting formulas or the towns do a very poor job of estimating property values between valuations, because we see some pretty big jumps in the total value of taxable property in town. Whenever you see a big change in valuation, the tax rate changes in the opposite direction (that is, when they consider that your house is much more valuable than it was the year before, your tax rate goes down, and vice versa).
The graph below shows the total assessed value of taxable property in each town by fiscal year. I find it somewhat odd that property has increased in assessed value in spite of the real estate market downturn, but this doesn’t really affect your taxes, only the tax rate you pay, which as you saw above, is constantly adjusted to raise exactly the budgeted funds.

Total property assessment by year for Amherst, Bedford, and Merrimack.
Now “budgeted funds” is the key term here, and combining the information in two graphs above lets us come up with the total amount of property tax money each town raises to cover their local education budgets. And this is the information that we need to understand how people’s actual local tax bills are changing over time. Remember that the amount raised by property taxes is the number that is left over after subtracting any state and/or federal money from the school budgets that we vote on in March. I have graphed these numbers below for clarity. When it comes to Bedford’s numbers, it can be useful to recall that they opened their new high school in 2007.

Taxpayer raised local education dollars for Amherst, Bedford, and Merrimack.
With all this in mind, we now can calculate, on average, how much our education property taxes have gone up with respect to FY 2001 numbers. For Amherst, the answer is they have increased, on average, by a factor of 2.2 (as of FY 2012), and we are the lowest of the three towns. The graph below has the details.

Growth in the total locally raised education spending, referenced to FY 2011 for Amherst, Bedford, and Milford.
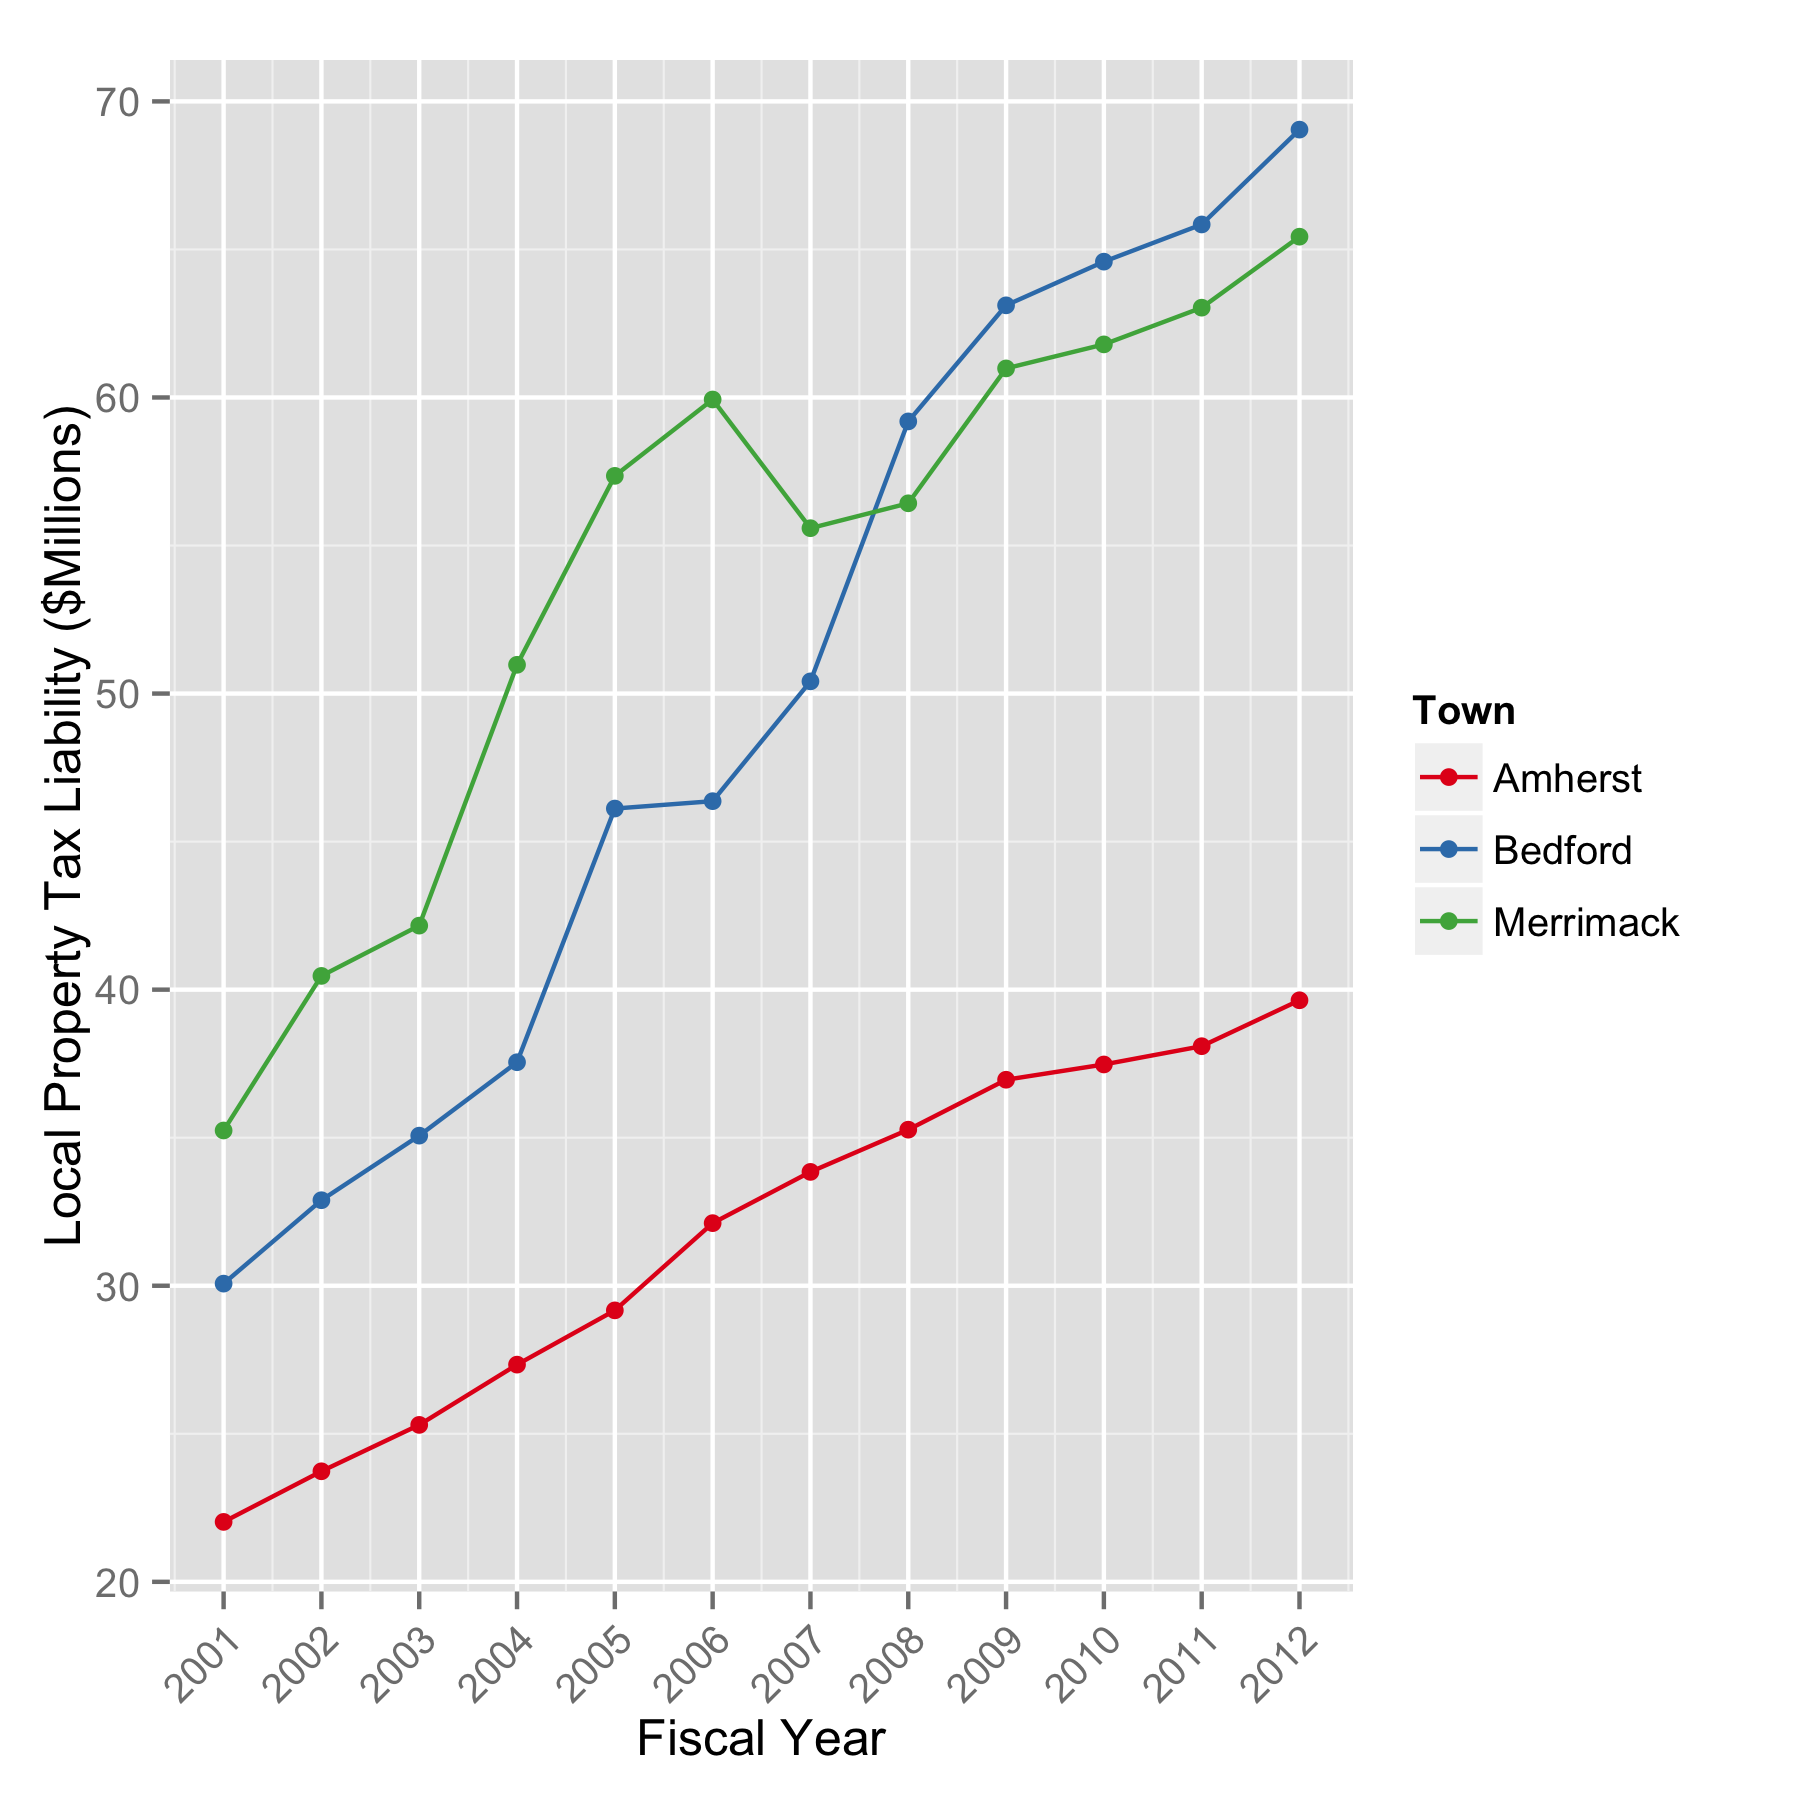
While this shows the bulk of the spending in each town, it doesn’t tell the whole tax burden story. What about everything else included in property taxes? It is easiest to just look at the total tax burden. We don’t really need to look at the rates, since a decrease in the rate doesn’t necessarily mean a decrease in spending. So below is the total property tax burden for each town, which includes the local education numbers from above, but also the state property taxes, and other town and county spending for Amherst, Bedford, and Merrimack.

Total tax liability for Amherst, Bedford, and Merrimack.
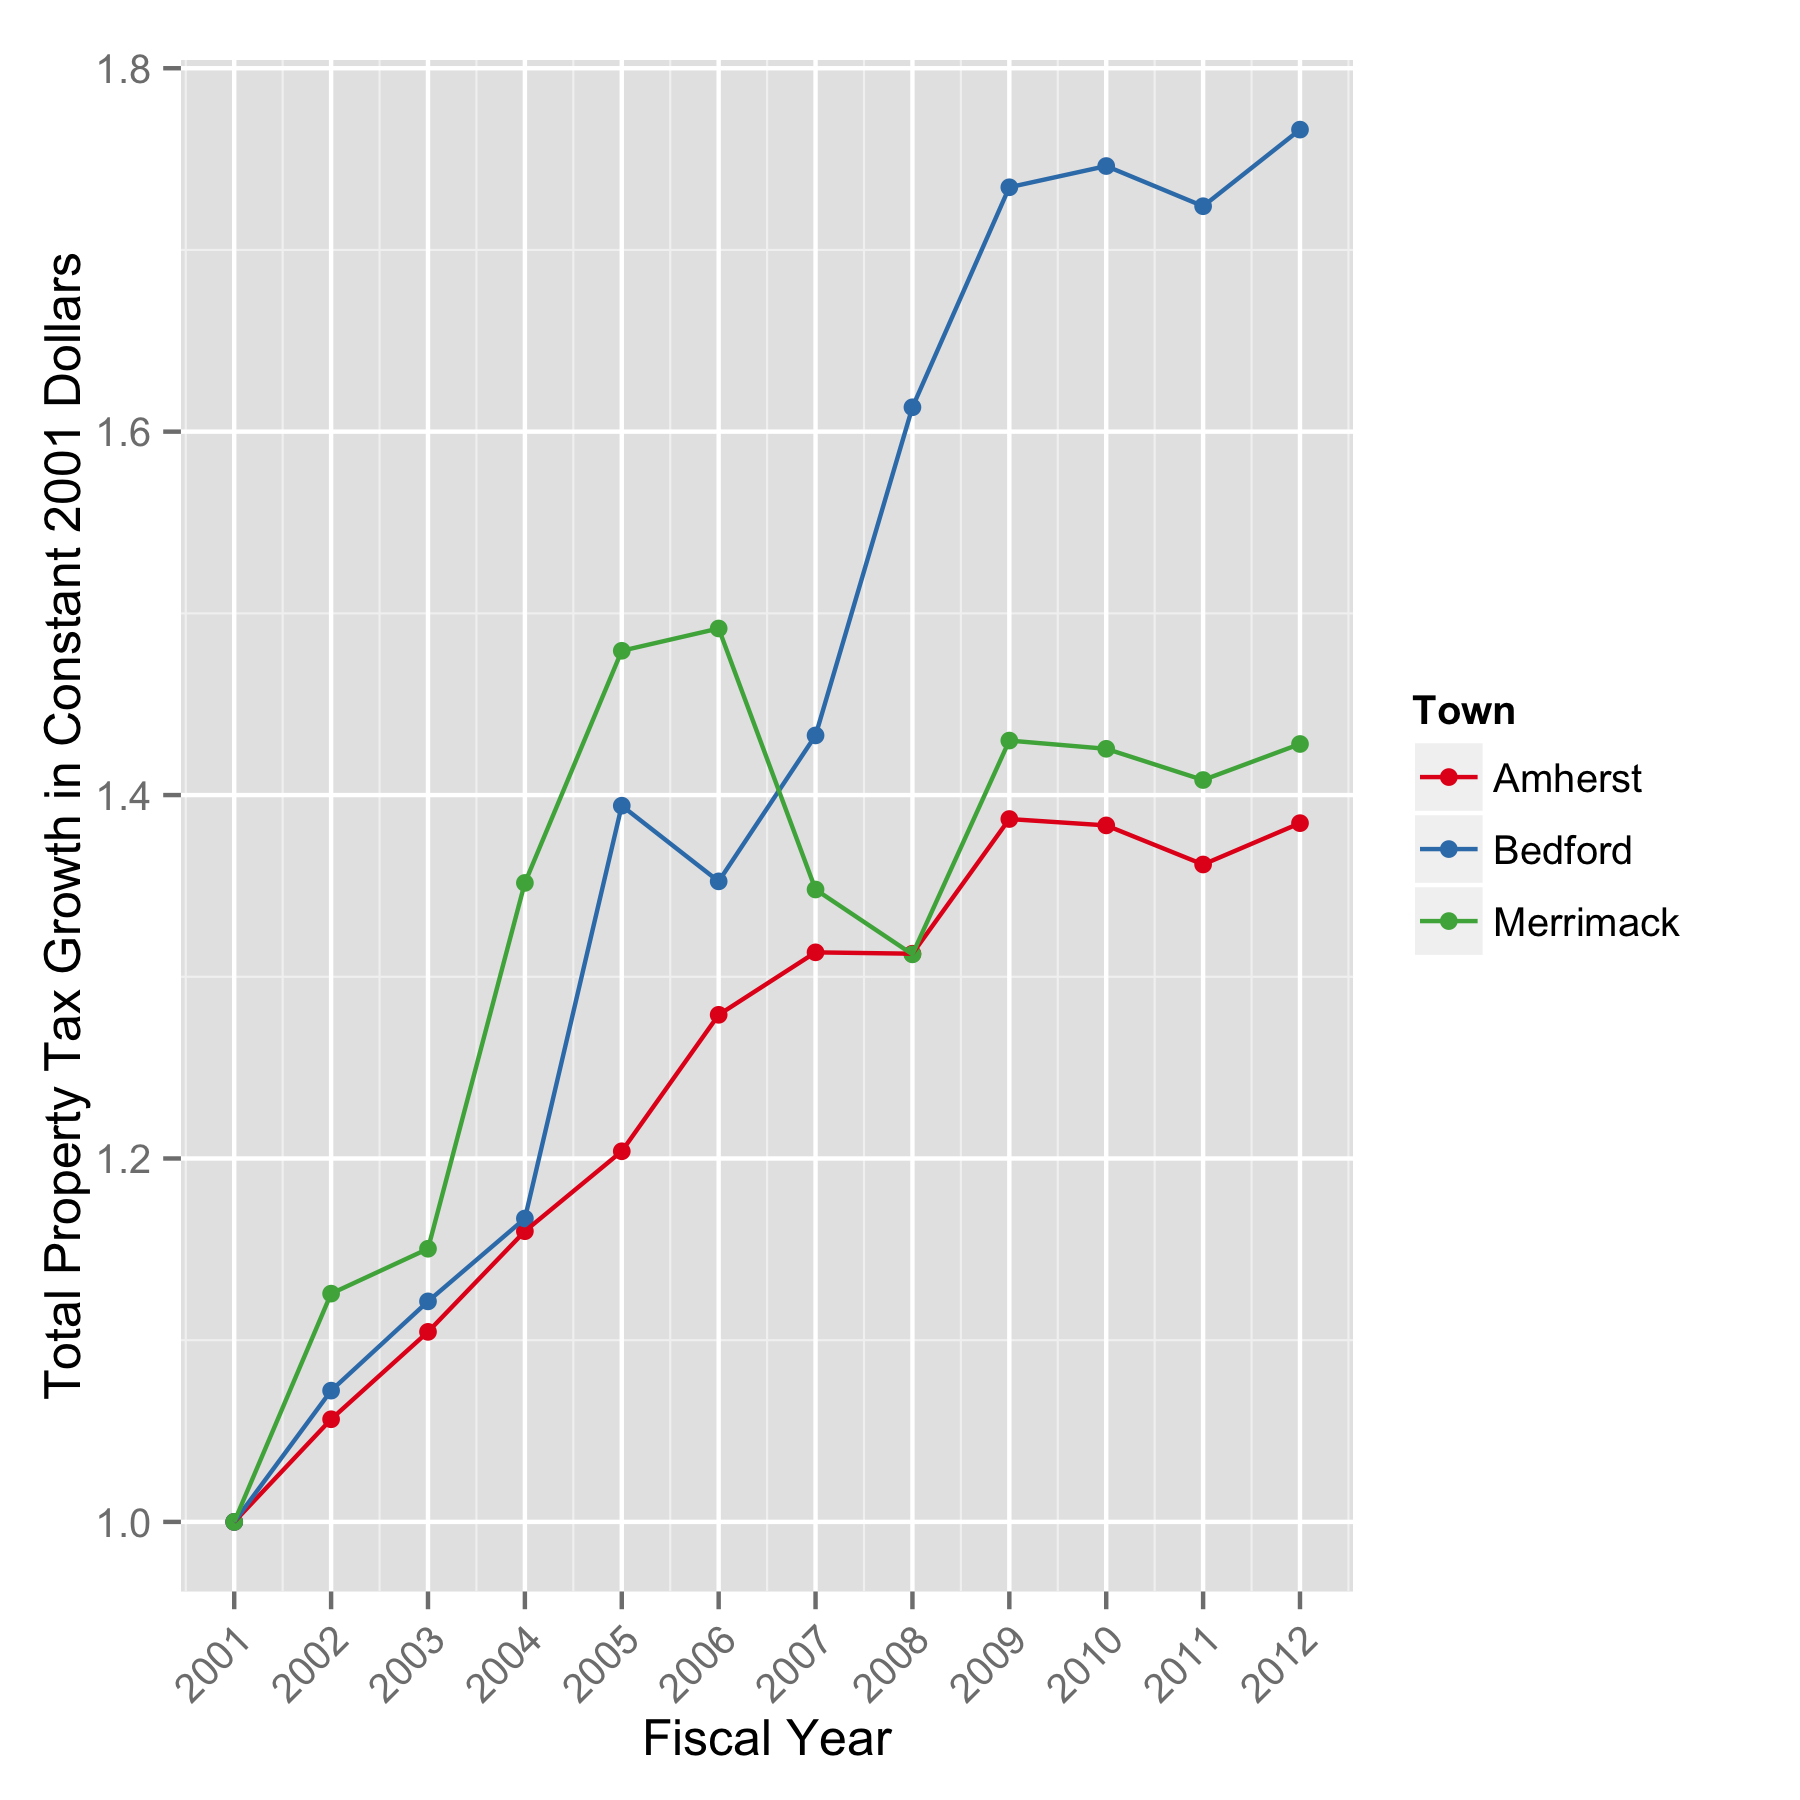
To put numbers on growth, we can normalize these to 2001 as we did before with the education budgets. It is interesting to see that Merrimack’s growth is reasonably close to ours, with a few years of exceptions. Compared to the other towns, Amherst looks fiscally responsible.

Growth in the total tax liability for Amherst, Bedford, and Merrimack.
So now we have the answer that we set out to find. Although our actual school tax rates have more than doubled, our total tax burden in Amherst has, on average, increased by a slightly smaller factor of about 1.8 since FY2001. Note that this is averaged over the whole town and how this impacts your household tax bill has much to do with how your property’s valuation has changed compared to the rest of the town.