The town of Amherst, NH has had much growth in the past few decades. Some insight into that growth can be found by digging through town records as published in our annual Town Reports (available in the Reference Room in the town library). Page 80 of the town report for the year 2000 provides data on the town’s annual population, as taken by Selectmen’s census, since 1960 and is shown here. I find it interesting that we had only 2000 people in town in 1960. These are very informative data, but are somewhat limited in value because in their short time scale.
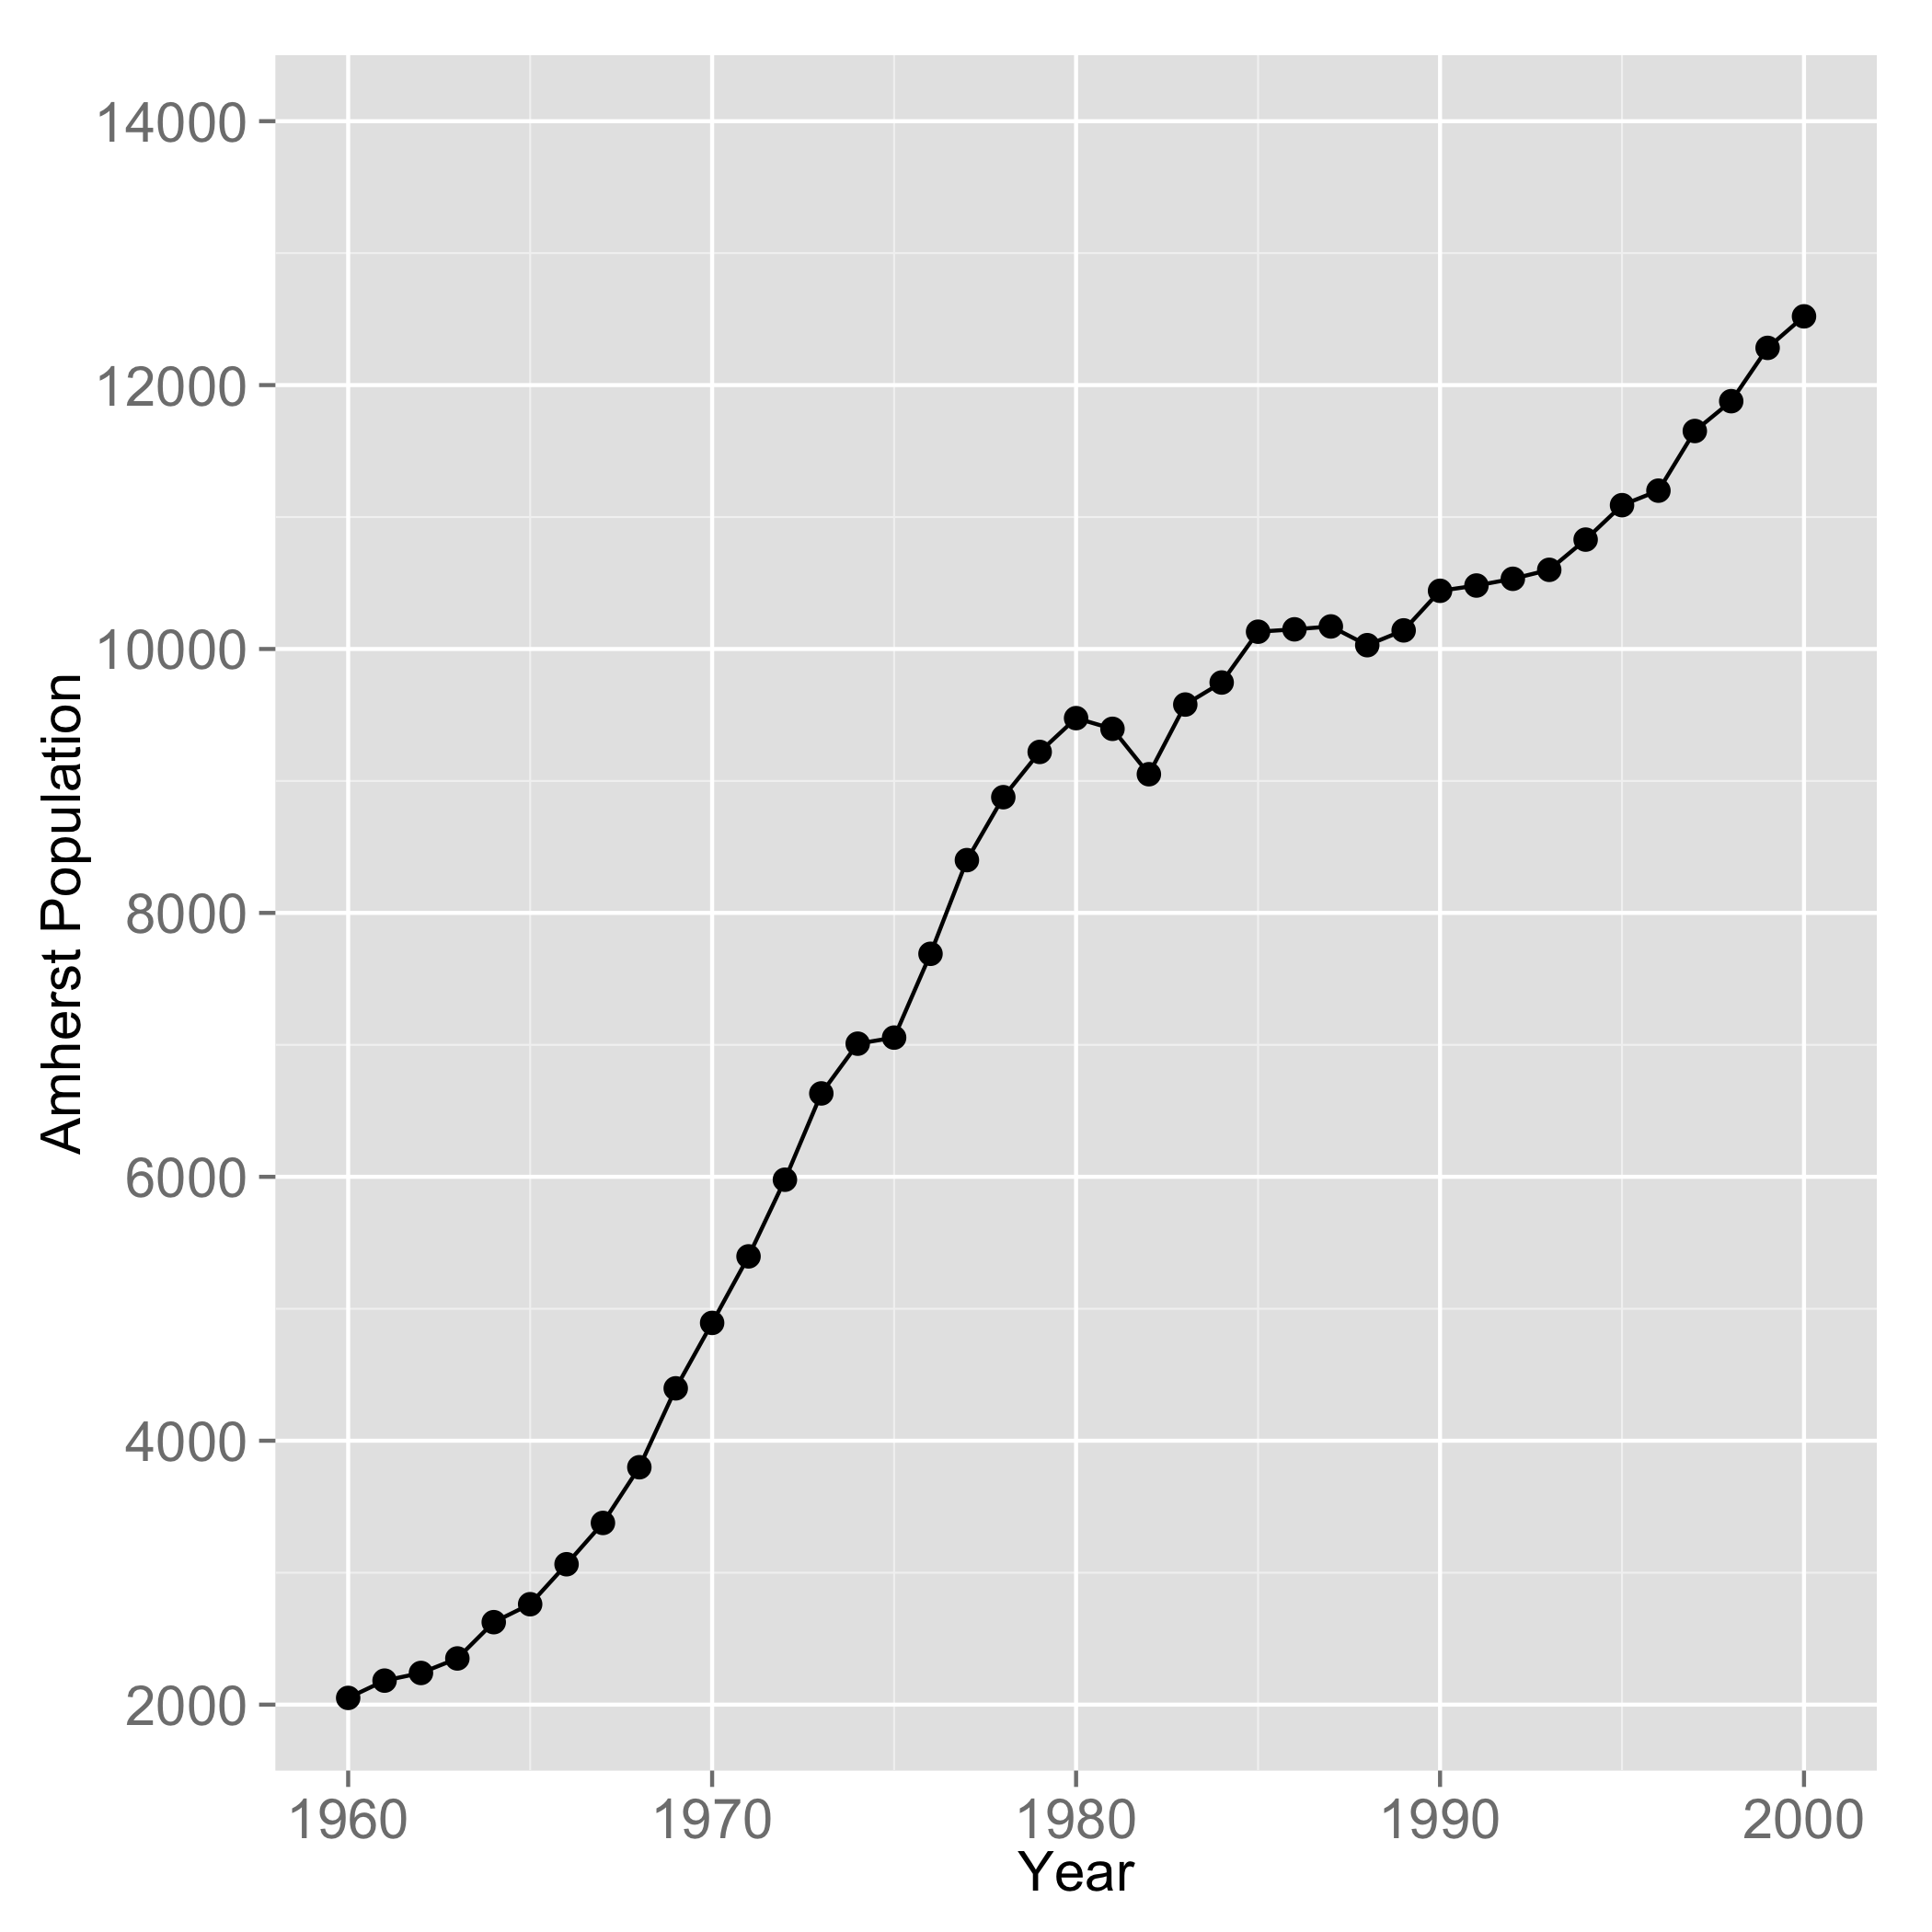
Amherst, NH population as recorded in annual town reports.
The US Census records the decennial population, something they’ve been doing since 1790, which is plotted below for Amherst from 1910 until the most recent one in 2010. Take note that the US Census data and the Selectmen’s Census from above do not generally agree in their absolute numbers, though they do follow the same trends during the years they overlap. These US Census data, while they does not contain the fine level of detail that the Selectmen’s Census does, paint a much broader picture of the history and growth of the town and are useful for that analysis.

US Census data for the town of Amherst, NH.
From is information, we can consider how and when our population has changed significantly. For this, we will examine the percentage of change of the population of town from the previous decennial census (graph appears below). These values paint a remarkable picture of the town’s growth. The 1960 and 1970 decades (1970 and 1980 census values) show enormous growth in the town. Between 1960 and 1970, the town’s population more than doubled (from 2061 to 4605). And from 1970 to 1980 it almost doubled again (4605 to 8243). After 1980, the growth rate plummeted and has remained relatively low.

The percentage change in the population of Amherst, NH from its previous decennial US Census.
To understand if this trend was broad or simply localized to Amherst, we can look at the same historic data for nearby towns. The US Census populations of Bedford and Hollis are plotted together below with the Amherst data from above. Note the large similar large population growths at approximately the same times.

US Census data for the towns of Amherst, Bedford, and Hollis, NH.
We can also calculate the percent change for Bedford and Hollis and plot those data with our Amherst data from above. The absolute values vary somewhat, but the data for the three towns all have in common several decades of large growth which peaked around the 1970 time period.
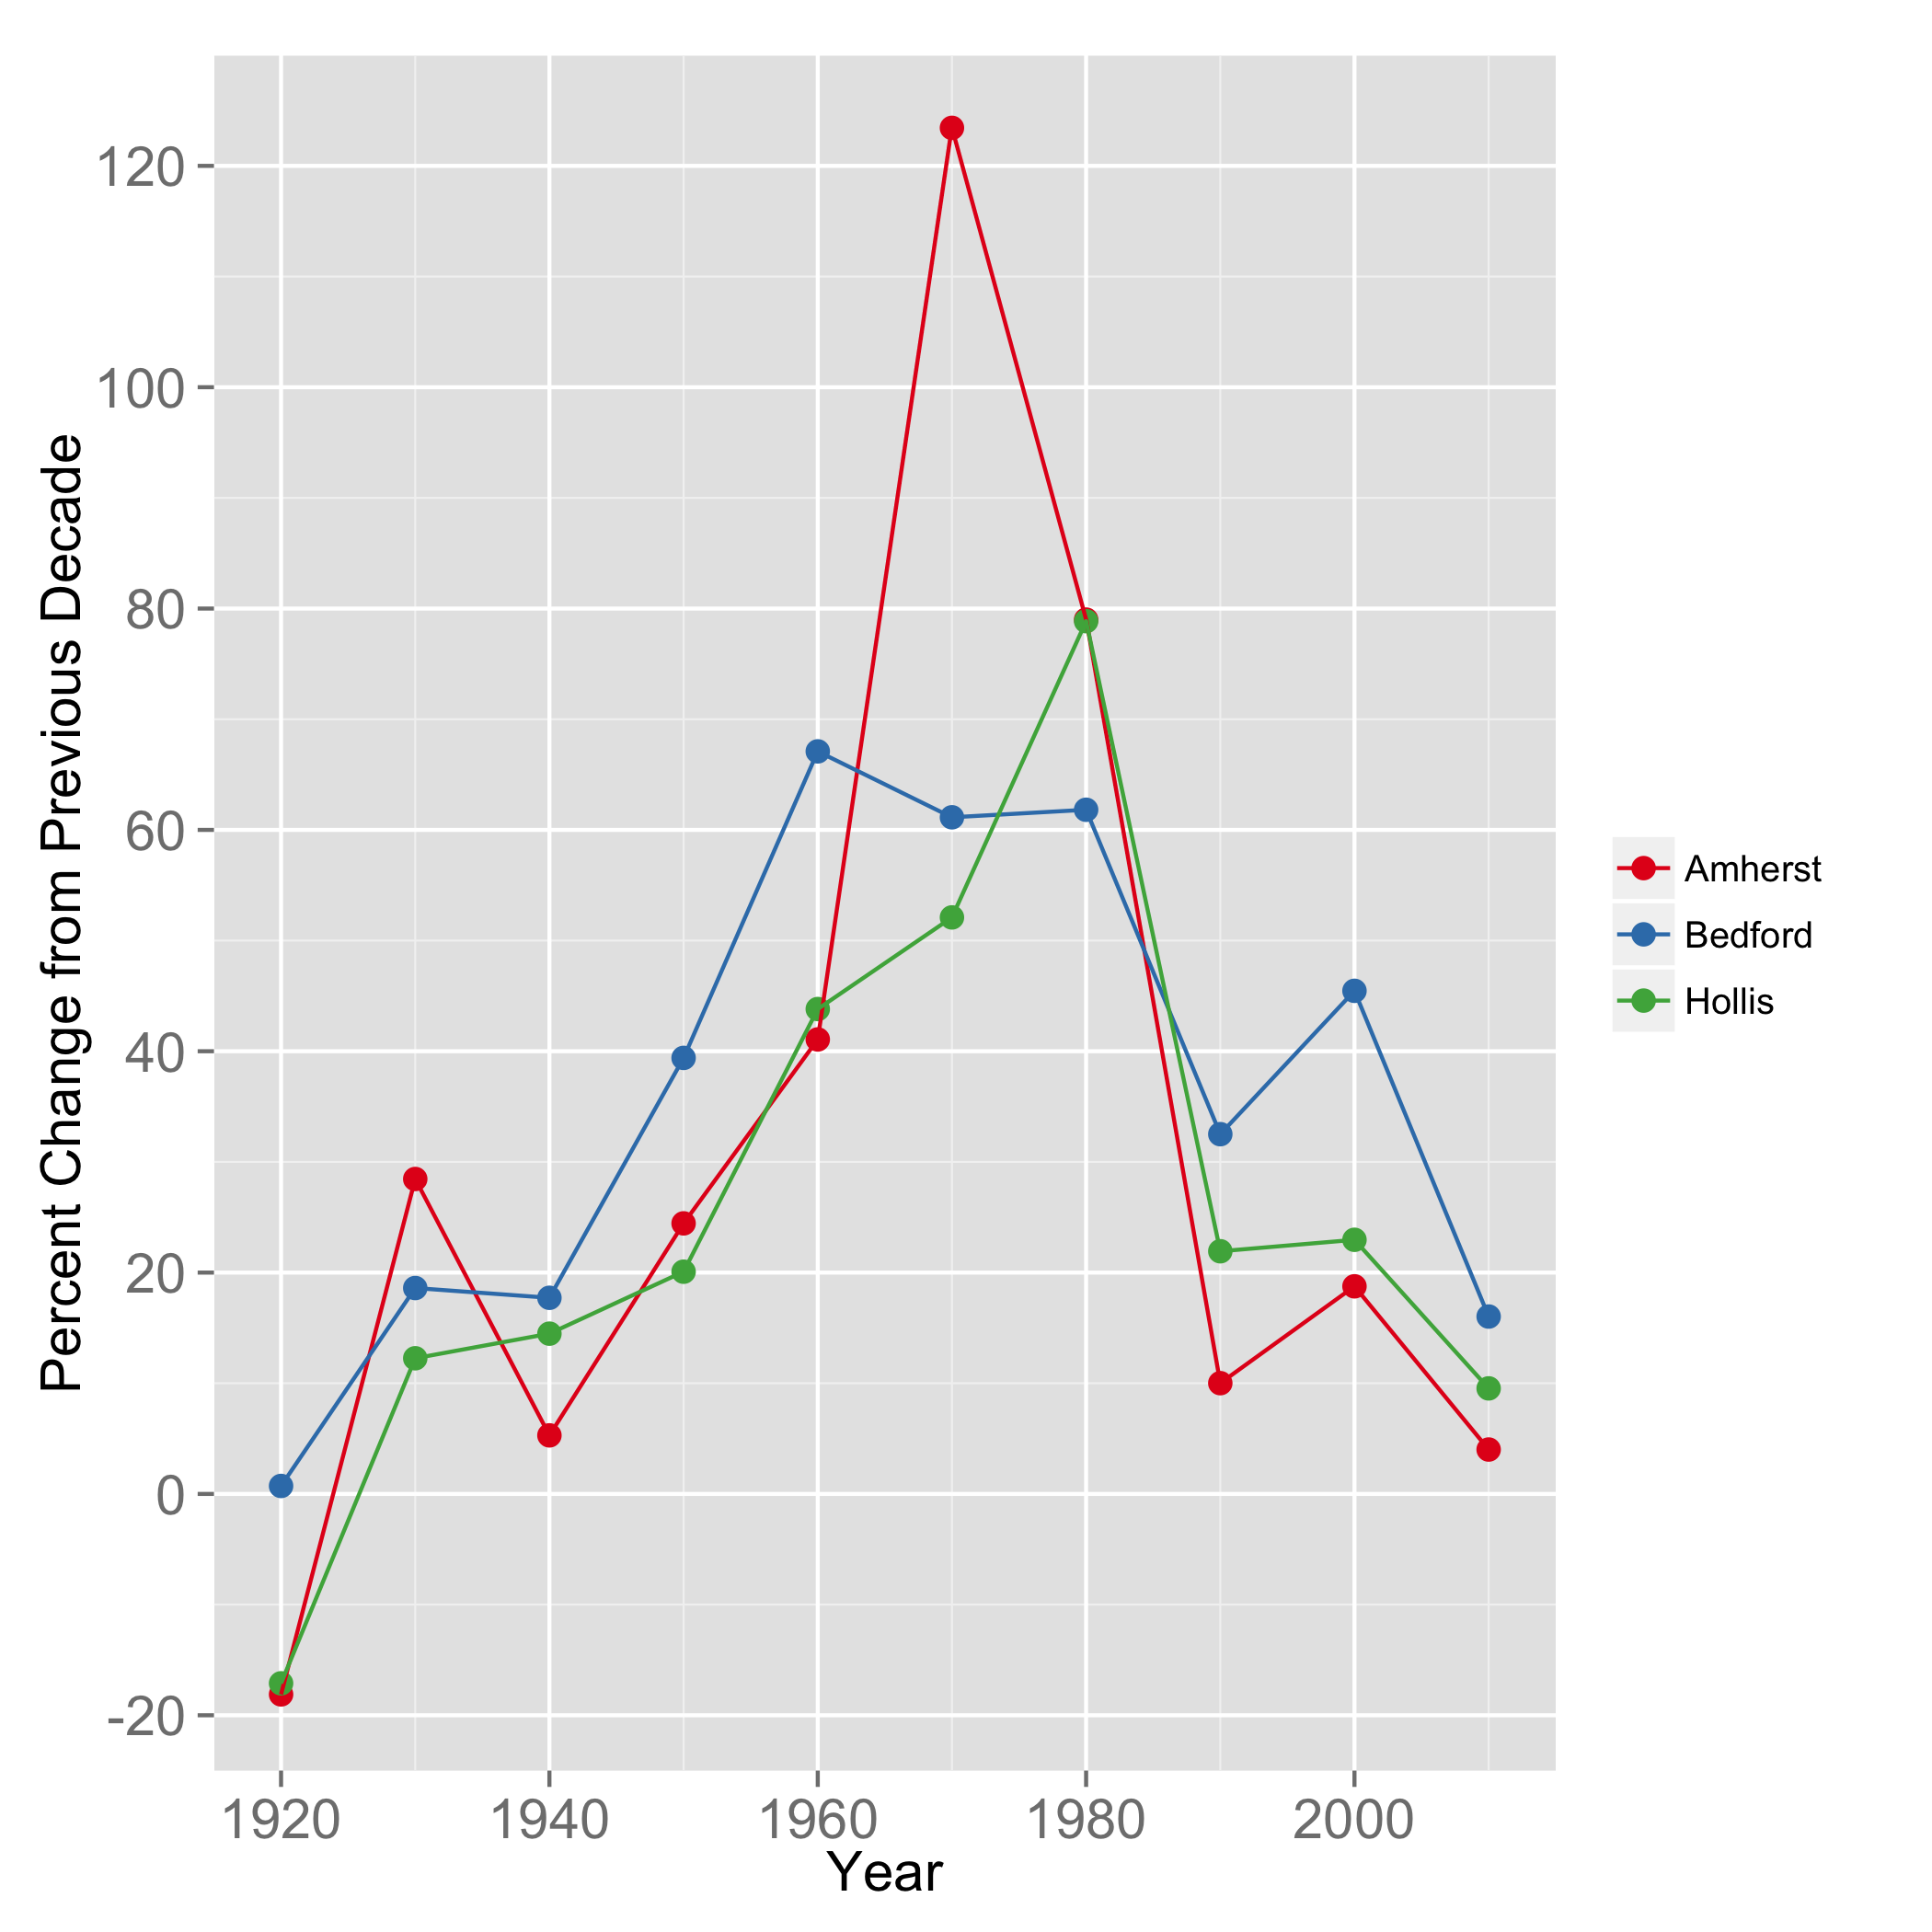
The percentage change in the population of Amherst, Bedford, and Hollis NH from their respective previous decennial US Census.
From these combined charts, we can conclude that the rapid population growth in the 1960s and 1970s was not localized to just Amherst. Amherst and its neighboring towns experienced a population boom in the decades following the “baby boom” (1946-1964).
