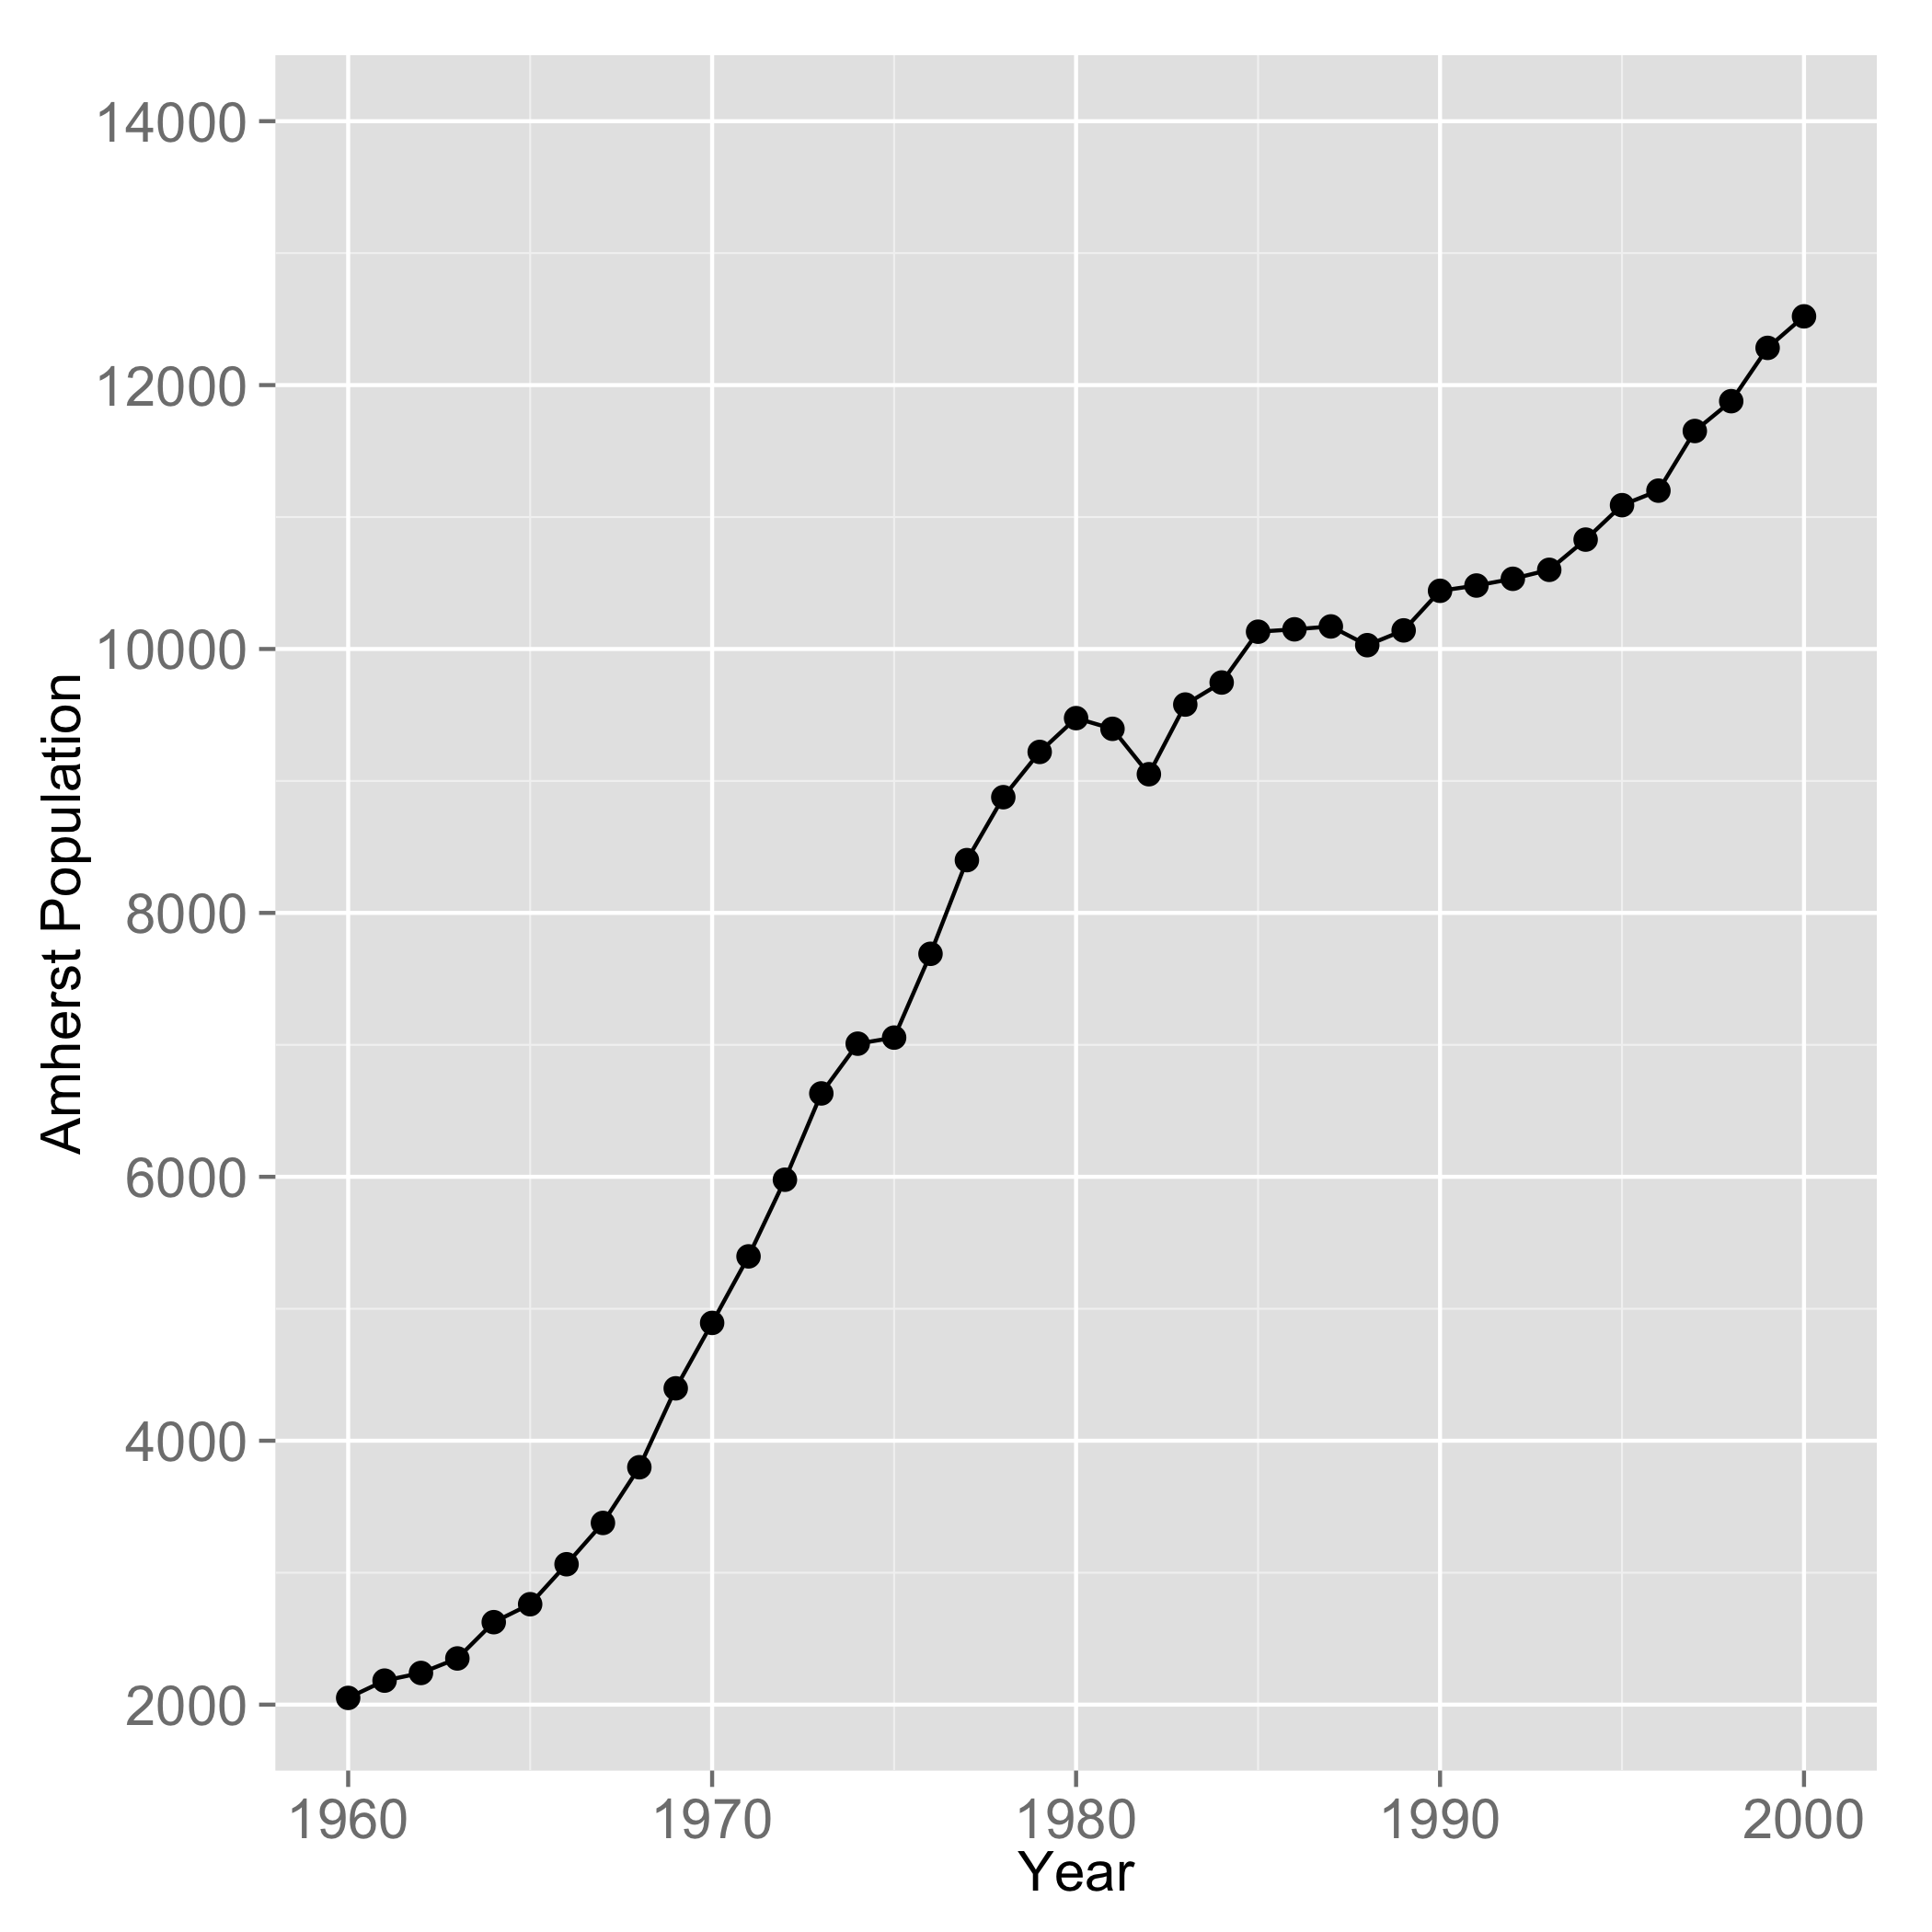
Between 1960 and 1980 the town of Amherst, NH underwent tremendous population growth. The US Census listed the town population at 2061 in the 1960 census and at 8243 in the one taken in 1980. That is, in twenty years time the town’s population doubled twice. This was a time when Amherst was transitioning from farms to the bedroom community as we know it today. Some questions we might want to consider are what might the town’s population look like in the future and where will whatever growth we have take place in town. The answers to these questions have a lot of impact on town planning needs, and frankly, these sorts of questions interest me in general.
In 1998 the town put together a master plan that, among other things, created a projection of the town’s population out to 2020. As you can see from the graph below, the blue master plan projection numbers assumed that the growth rate of the last twenty years would continue into the next twenty years. And maybe even increase a bit. The forecast being created in 1998, the 2000 number matches well with the 2000 US Census, but overpredicts the 2010 numbers by about 1000. Given the amount of developable land remaining in town and the zoning laws we have (e.g., 2 acre minimum lot sizes for new developments), the rest of the forecast looks suspiciously high.

Historic Amherst, NH population (red) and 1998 Master Plan projection (blue).
In 2013 the State of New Hampshire’s Office of Energy and Planning put together municipal population forecasts for New Hampshire towns out to 2040. Their projections are considerably more cautious than the ones the town created 15 years earlier, and suggest that we will slowly reach a peak population of about 12,000 people in about the next two decades. In other words, population growth in Amherst is expected to continue, but not at rates even close to what the 1998 predictions suggested.

Historic Amherst, NH population (red) and 2013 state projection (yellow).
This seems to be reasonable. Thanks to the fine folks at the Nashua Regional Planning Commission, we can take a look at the land usage in Amherst to get a feel for how much and where land is available in town for future growth. In the plot below I have colored the various land usages in Amherst to correspond with how they are used. So there are conservation land, lots currently used for housing, town property (schools, town offices, cemeteries, recreation land, etc.), commercial or industrial land, and wetlands and floodplains. The uncolored lots are (or should be) available for development, although I can’t comment on how feasible they are. It is an interesting map, and worth a close up look. Perhaps 12,000 or so is the most people we can actually have in town.
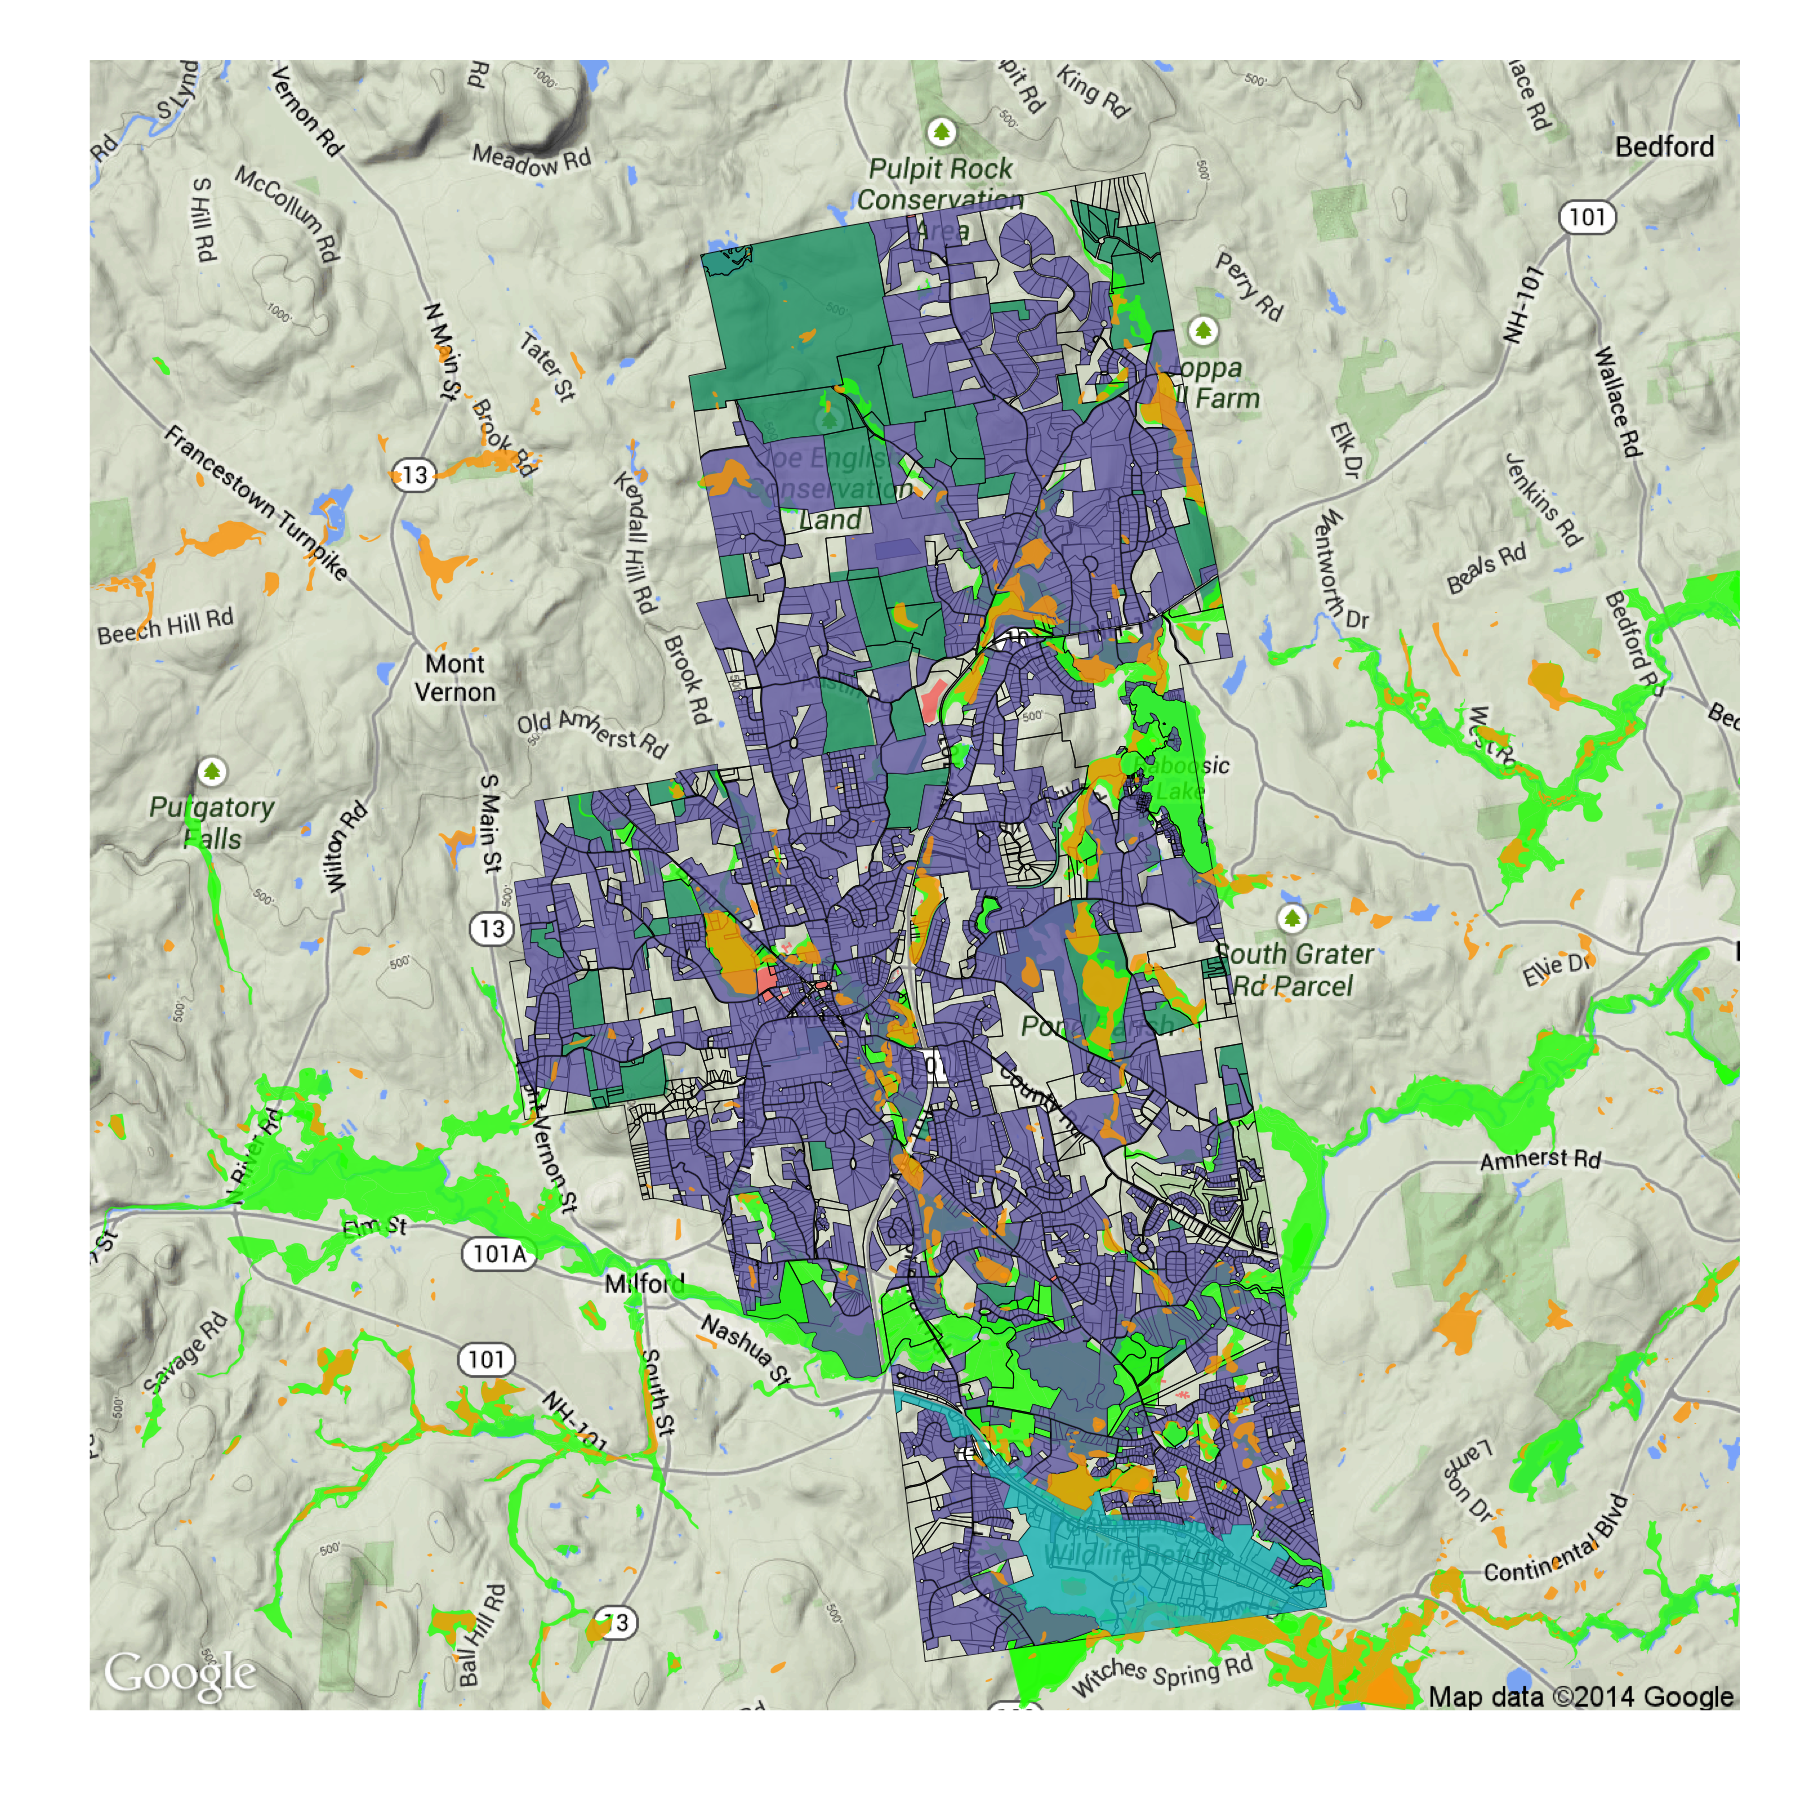
Amherst, NH parcel map. Colored lots are either developed, conservation land, town property, commercial/industrial, or floodplain/wetland. Data courtesy of Nashua Regional Planning Commission.
The map above should be understood as a guide, as I can’t validate when the NRPC updates their parcel usage data. But clearly the unused land that is available for potential development is in the minority of land in town, and that will be the limiting factor to the town’s future population.