A few nights ago I was re-reading a P.J. O’Rourke book on terribleness. In the chapter on famine, everyone’s favorite bedtime reading subject, something he said struck me. “In most of the world, food production has well outpaced the growth of population. In the 1930s American wheat growers had an average yield of thirteen bushels per acre. By 1970 the yield was thirty-one bushels. In the same period the corn yield went from twenty-six bushels per acre to seventy-seven.” This was unexpected. I have the picture in my mind of the differences between arithmetic and geometric progressions when it comes to comparing food production and population. This is courtesy of Rev. Malthus, whose treatise was nicely summarized in the same book on terribleness in the chapter on overpopulation: “…there’s no end to the number of babies that can be made, but you can only plant so much wheat before you run the plow into the side of the house.”
According to data from the fine folks at the USDA, the story here is rather interesting. Yes, the wheat yield in the 1930s was in the low teens. But what is surprising is that it had been there at least since the USDA began recording wheat crop yields in 1866! In other words, the amount of wheat an acre of farmland produced showed no significant improvements for at least some seventy years, until the early 1930s. Since then, however, it has increased at a roughly constant rate, reaching its all time high of 47.1 bushels per acre in 2013. And it hasn’t settled at that yield; it continues to increase.

U.S. wheat crop yields, in bushels per acre. 1866-2014.
It should come as no great surprise, then, that corn yield numbers tell essentially the same story. But I was surprised by the fact that the upturn in the yield happens at about the same date. Corn production was a flat 25 bushels per acre for decades and started its way upward at about 1930. For the curious, it peaked at 173.4 bushels per acre in 2014 and continues to climb as well. That is a huge number. A corn farmer in 1900 working hard to get his 28 bushels per acre never in his most fantastic dreams thought yields like this were possible.

U.S. corn crop yields, in bushels per acre. 1866-2014.
We can look at this another way, by plotting the corn yield against the wheat yield. And what we see is that the relationship is well behaved. When wheat yields increase, so do corn yields, though not necessarily in the same proportion. After a point, every 10 bushels/acre growth in wheat equals about a 40 bushel/acre growth in corn. This suggests there is more to the story — that there is some common factor that drives this effect.
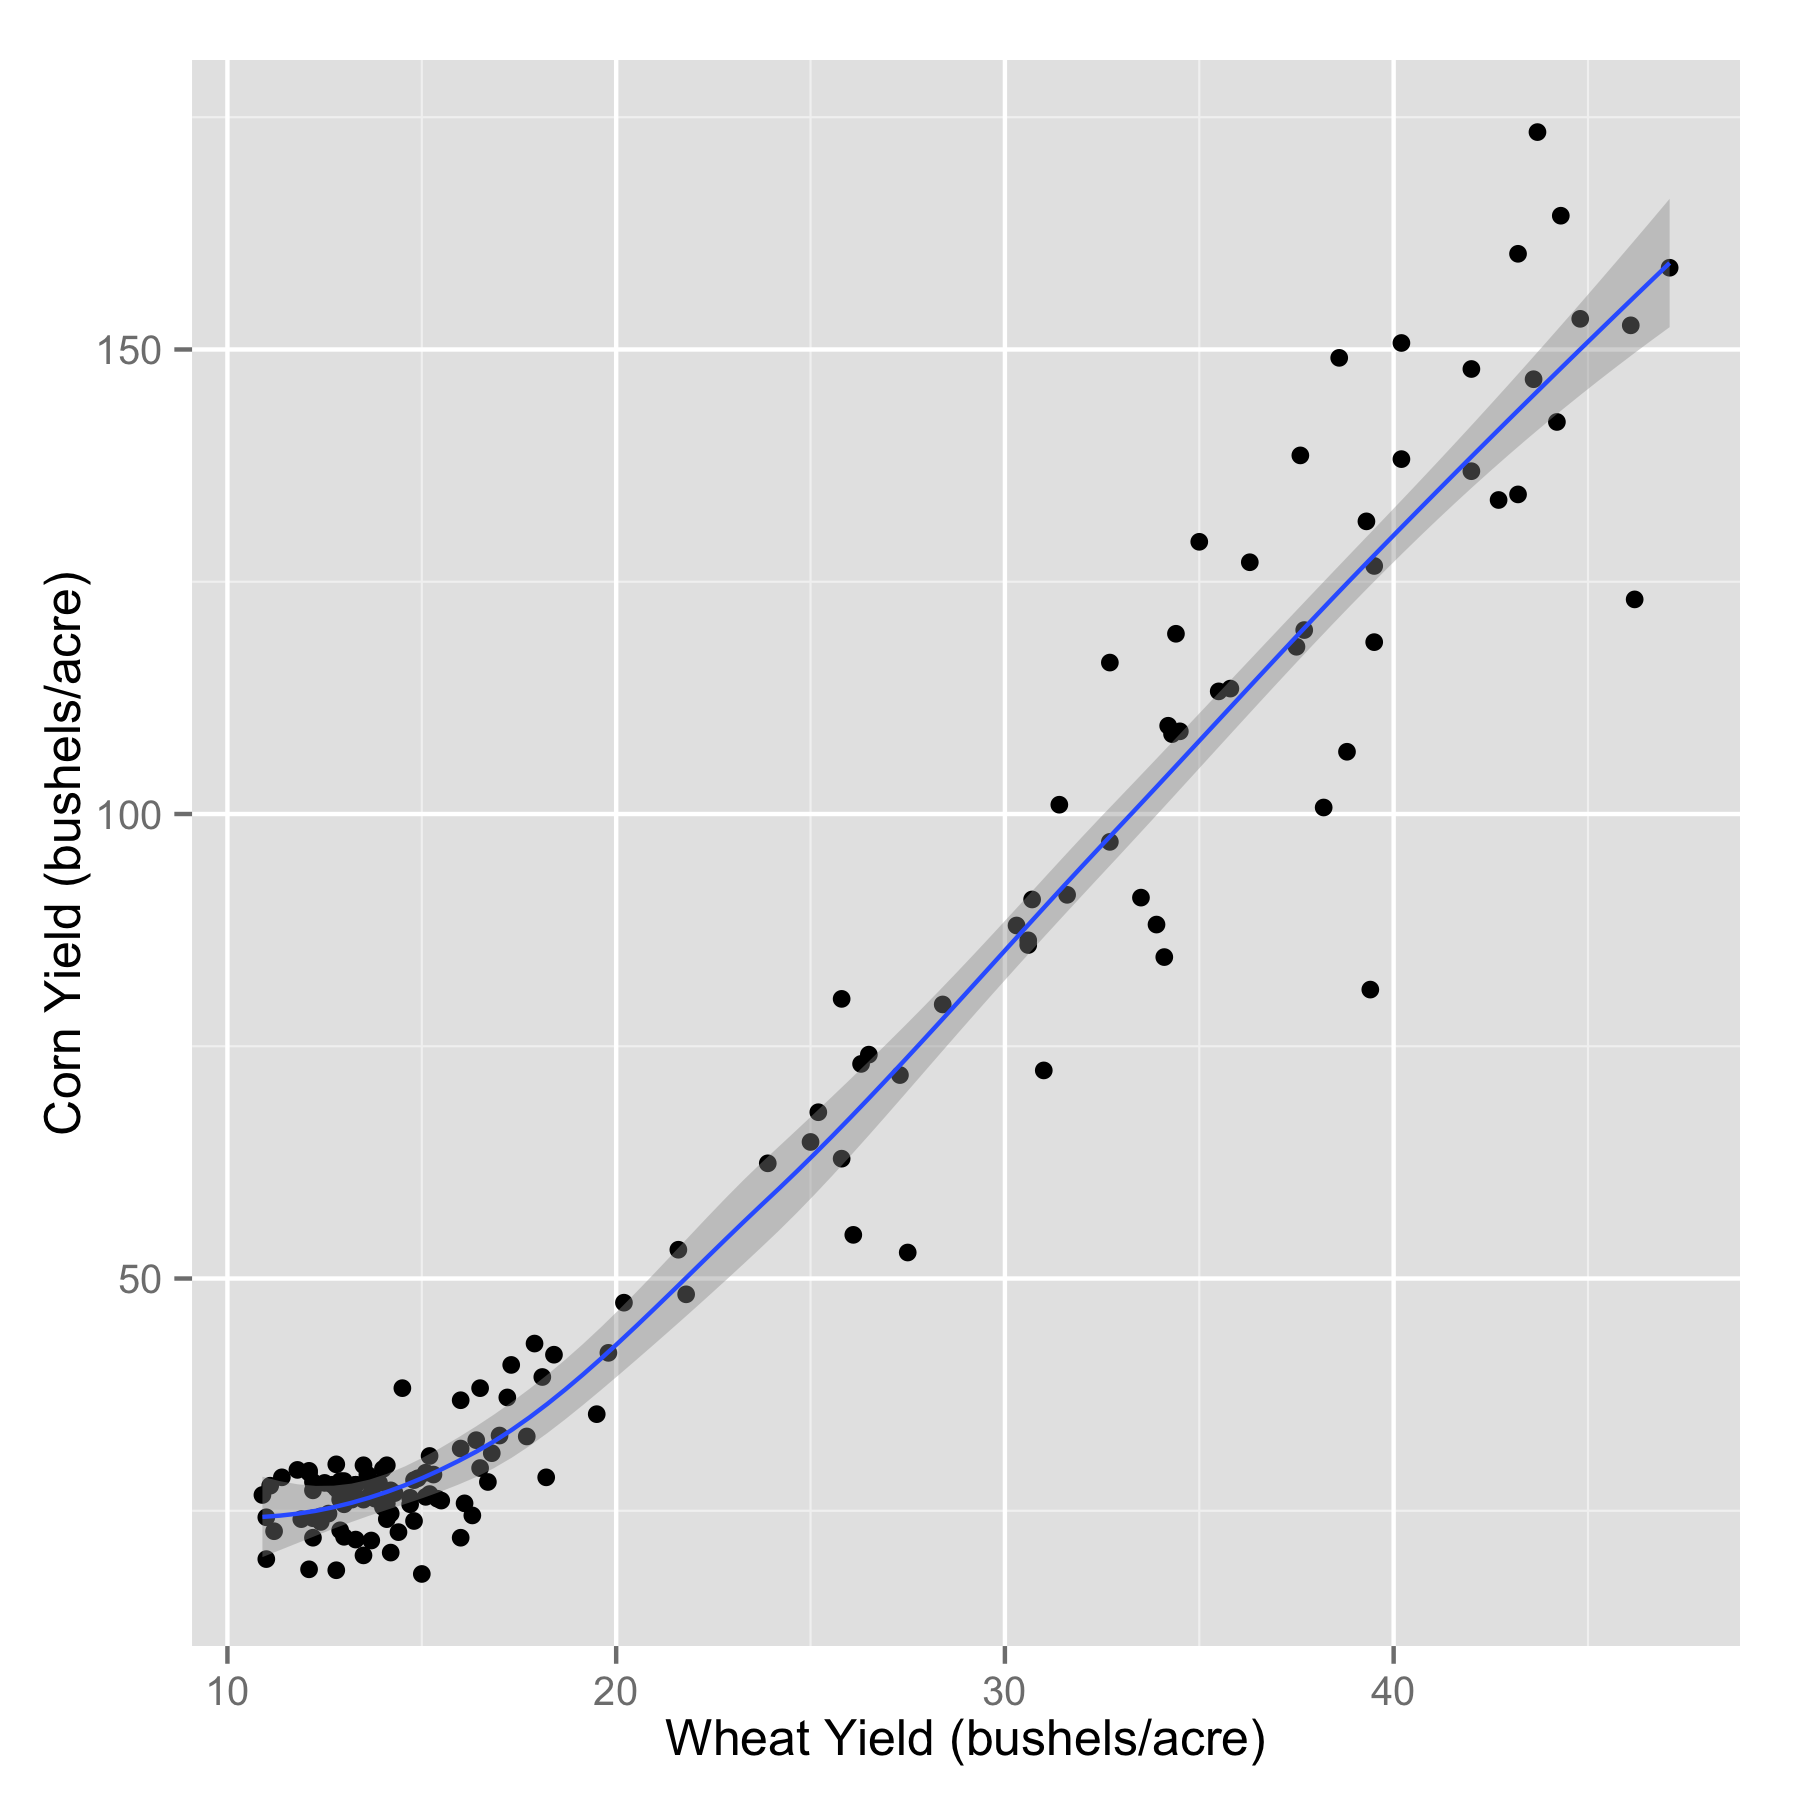
The crop yields for U.S. corn plotted against the yields of U.S. wheat for the years 1866-2014.
And there is more to the story. The USDA doesn’t just measure wheat and corn production. They determine the yields for all of the field crops. So that we can compare like things, first are the crop yields that are measured in bushels per acre: barley, corn, flaxseed, rye, sorghum, soybeans, and wheat. Of those, only rye and sorghum yields look as though they have stopped increasing. The rest show this continuously increasing trend over time, starting around the same year — 1930.

USDA crop yields (bushels/acre) for barley, corn, flaxseed, rye, sorghum, soybeans, and wheat.
And then we have the crop yields that are measured by weight (pounds per acre). These are: beans, cotton, hay, hops, peanuts, peppermint oil, rice, spearmint oil, sugarbeets, and tobacco. These also show the same yield growth since about 1930 behavior. Interestingly hay and tobacco yields seem to have joined rye and sorghum yields in leveling off (showing classic error function behavior).

USDA crop yields (pounds/acre) for beans, cotton, hay, hops, peanuts, peppermint oil, rice, spearmint oil, sugarbeets, and tobacco.
If it wasn’t clear before, it is now. Sometime around the 1930s, something quite dramatic began to happen in field crop production. An agricultural revolution of sorts. And while the effect is present for all of them, it varies in its impact depending on the crop. To show this, we normalize the yield rate by the average of the first few years in the dataset for a given crop. This shows us how the yield rate has grown in time. And we can compare them all if we plot them all with the same y-axis scale (conveniently done below). So the biggest crops in terms of yield rate growth are: corn (~7x), cotton (~6x), peanuts (~5.5x), rice (~7x), sorghum (4-6x).
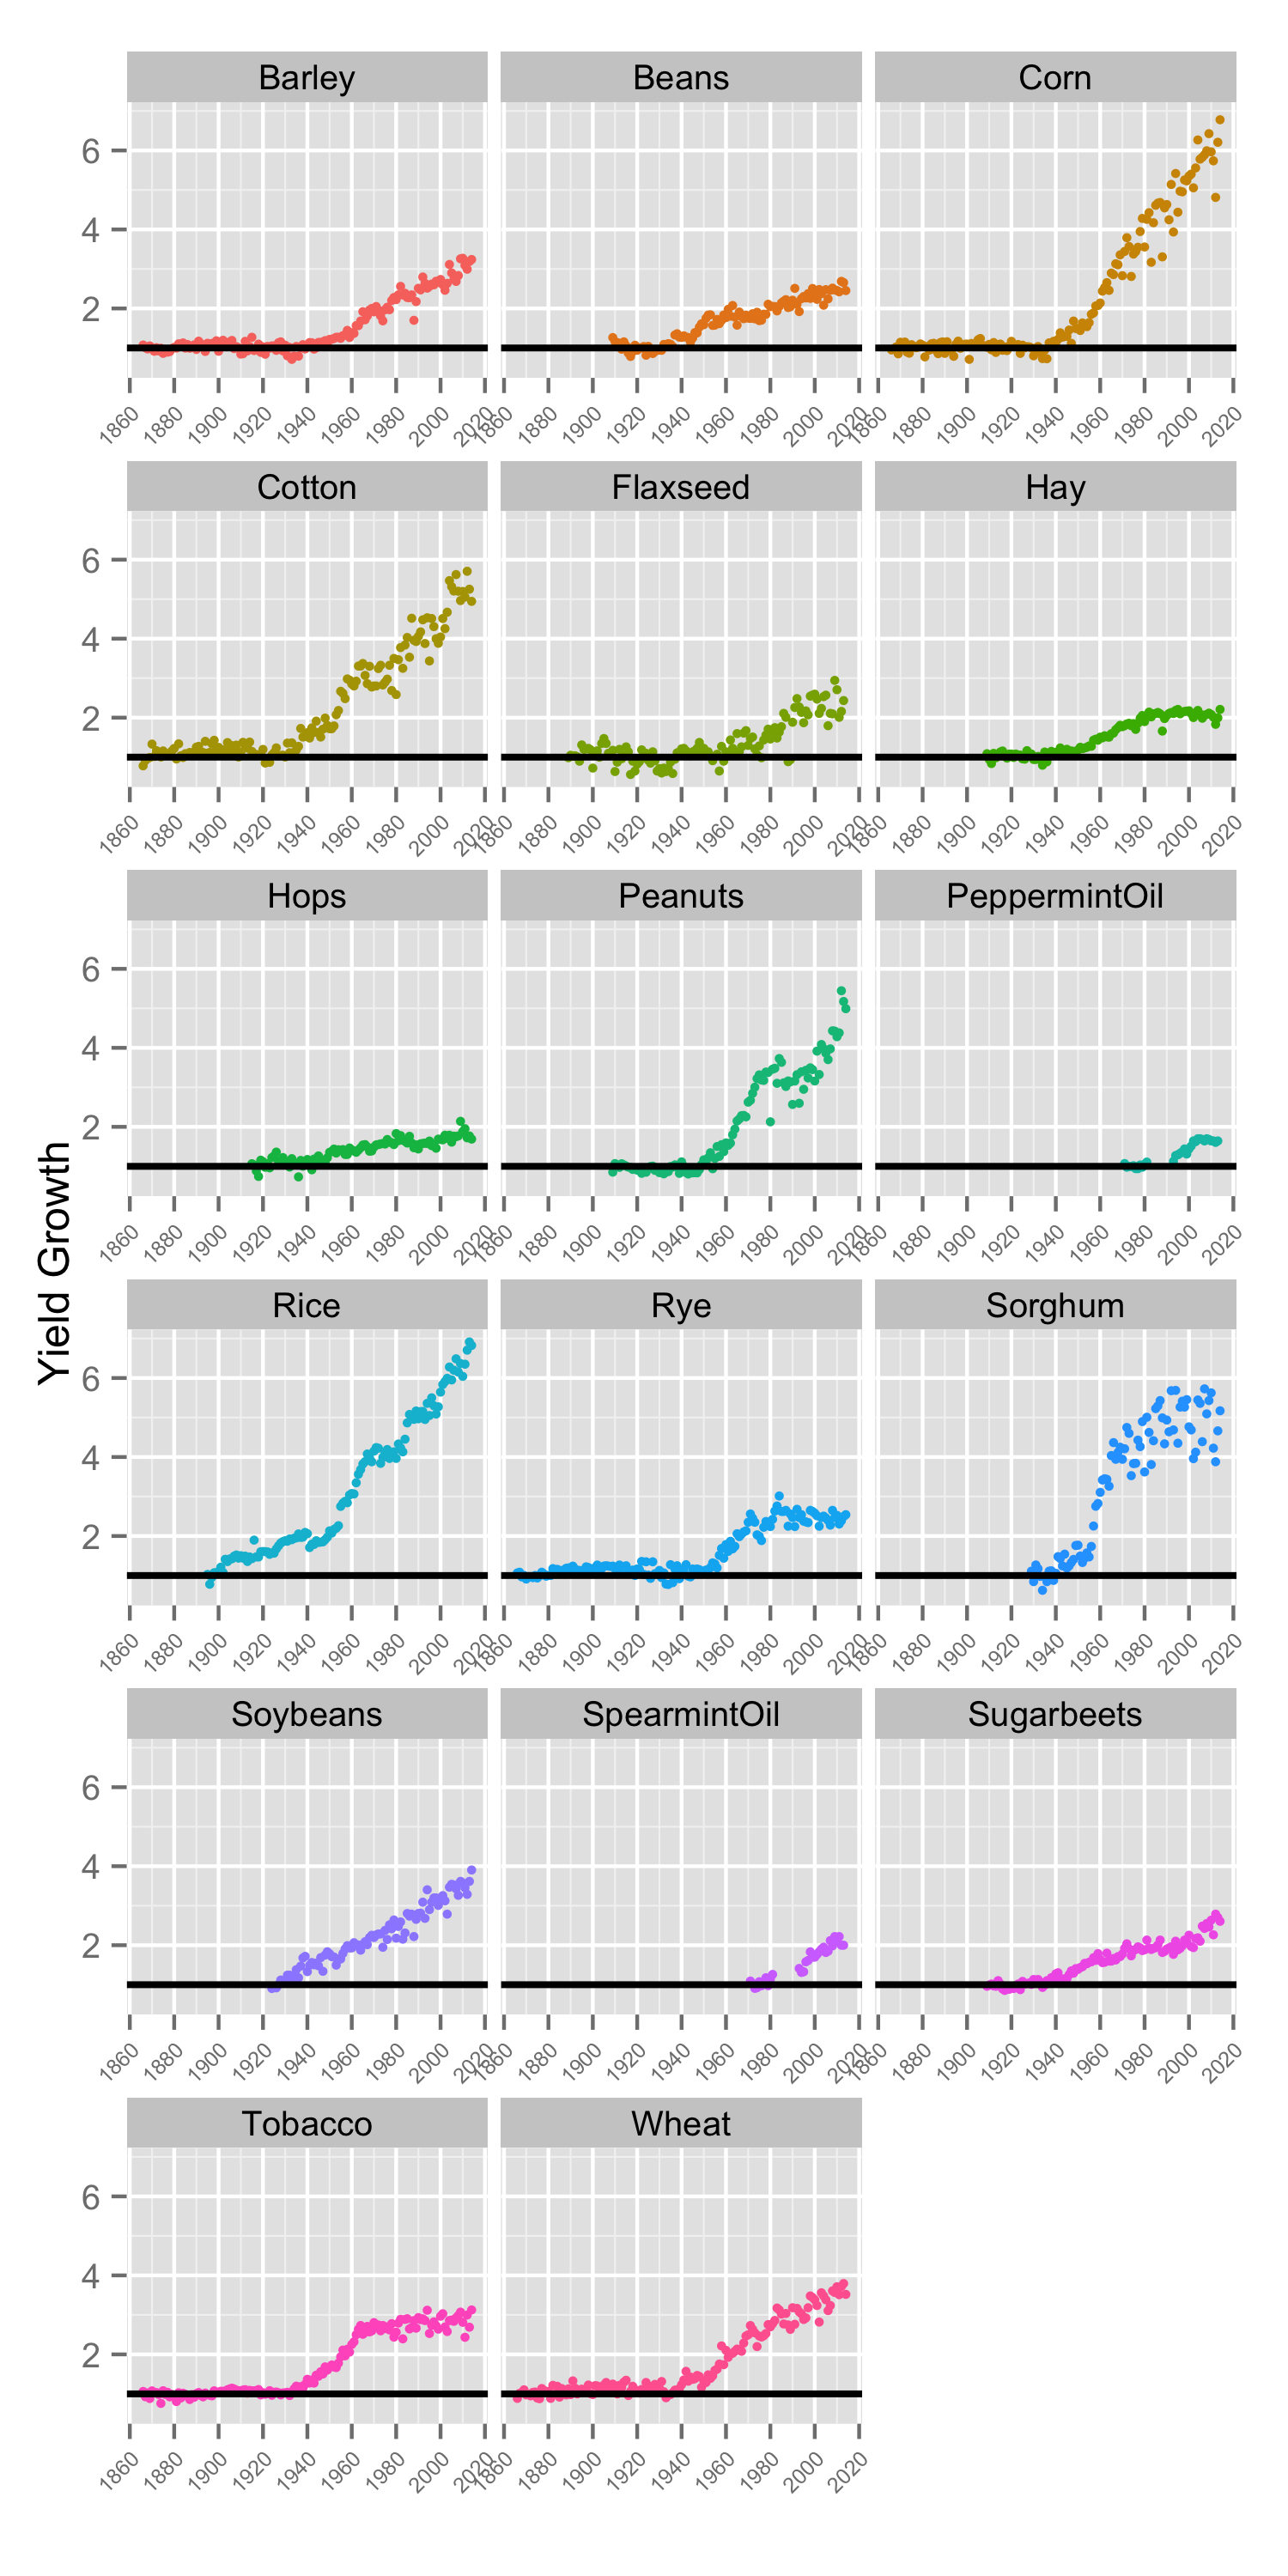
Yield growth in US field crops. Plotted is the multiplier in the yield rate since the start of data collection for the given field crop.
I find it interesting that the curves for soybeans and cotton begin to increase in 1920, which is a few years before the others. Peanuts seem to be among the last to join the group as their yield didn’t start taking off until about 1950. Did some experimentation take place with soybeans and cotton crops and then once successful transition to other crops such as wheat, corn, and then peanuts? Soybeans became quite important in the US around 1910, so this is plausible. Though I haven’t found anything to suggest this is what actually happened.
We do know that hybrid seed became all the rage starting around 1930. Gregor Mendel demonstrated plant hybridization in the 1860s with peas, but it wasn’t until the 1930s when hybrid seed was able to produce a corn crop that was well suited to mechanical harvesting. One report says: “The tractor, corn picker, and hybrid seed corn came together to raise labor and land productivity in corn production in the late 1930s.” Tractor development (power takeoff, rubber tires) and sales really started to take off in the 1920s, which fits the timeline perfectly. And I’ll bet that improved chemical fertilizers and pesticides factor in as well.
In any case, I should go back to the original statement where O’Rourke said food crop yield rates were increasing faster than the population. In 1927 the world’s population is estimated to have been about 2 billion people. This is convenient for our comparison as it about coincides with our 1930 start of this agricultural revolution. Corn and wheat yields both doubled by about 1960, when the global population was about 3 billion (a 1.5x increase). So far, so good. And we reached about 7 billion people in 2012, an increase of a factor of 3.5 since 1930. This about matches the rate of increase in wheat production. But corn and rice have managed to stay ahead by a considerable margin, so O’Rourke is right and Reverend Malthus has been wrong. At least, since this “revolution” started.
But these crop yield numbers aren’t global numbers, they’re for domestic production. How do they compare against the growth in the U.S. population? Quite favorably, it turns out. In 1930 the U.S. population was about 123 million. It grew by about 50 percent to about 180 million in 1960, which is in line with global population increase we just considered, where crop yields for corn and wheat doubled. But in 2012 the U.S. population reached 313 million, a growth factor of only 2.5x over 1930. The slowest of the food crop yields shown above have at least grown at the same pace as the domestic population. But the major food crops like corn and rice are out in front by a mile, with their yields growing some 2.8 times faster than the growth in domestic population.
This is startling, but in a good way. It is a win for science and innovation and demonstrates how humans can manipulate their situation to work to their advantage. The primary food crop yields show no signs of leveling off. It makes sense that they probably will at some point. But for now it is nice to know that the Reverend Malthus is wrong.
