After my last post on the remarkable increase in field crop yields in American agriculture, I was interested in seeing where else yield improvements were observed and hopefully getting a better understanding of the causes. I’m interested in understanding how much of the impact mechanization (i.e tractors and harvesters) had as opposed to improvements in seed, fertilizers, and pesticides. Certainly all of these came together to boost productivity, but what had the greatest impact?
So on to (non-field crop) vegetables. The same USDA website has statistics for vegetables as well as for field crops, but to get any data of any historical significance, we can’t afford to be choosy. Only two crops have data going back to the pre-1970s days, and thankfully they go back to the 1860s. So here we have the crop yield data in cwt/acre (cwt is a centum weight, or hundredweight—a one hundred pound increment) for potatoes and sweet potatoes. Given what we have already seen, this isn’t terribly surprising. It looks much the same as the graphs for corn or wheat. That is, a relatively flat yield curve until the 1930s followed by a sharp upturn and a monotonic increase spanning seven decades. I still find this to be remarkable.

Potatoes and Sweet Potatoes yields in centum weight/acre (1868-2014).
And what about how the yield has grown? Looking below we can see that potatoes are 8 times more productive than they were some seventy years ago. Considering the crops we have looked at so far, that is the record (beating rice’s sevenfold yield increase).
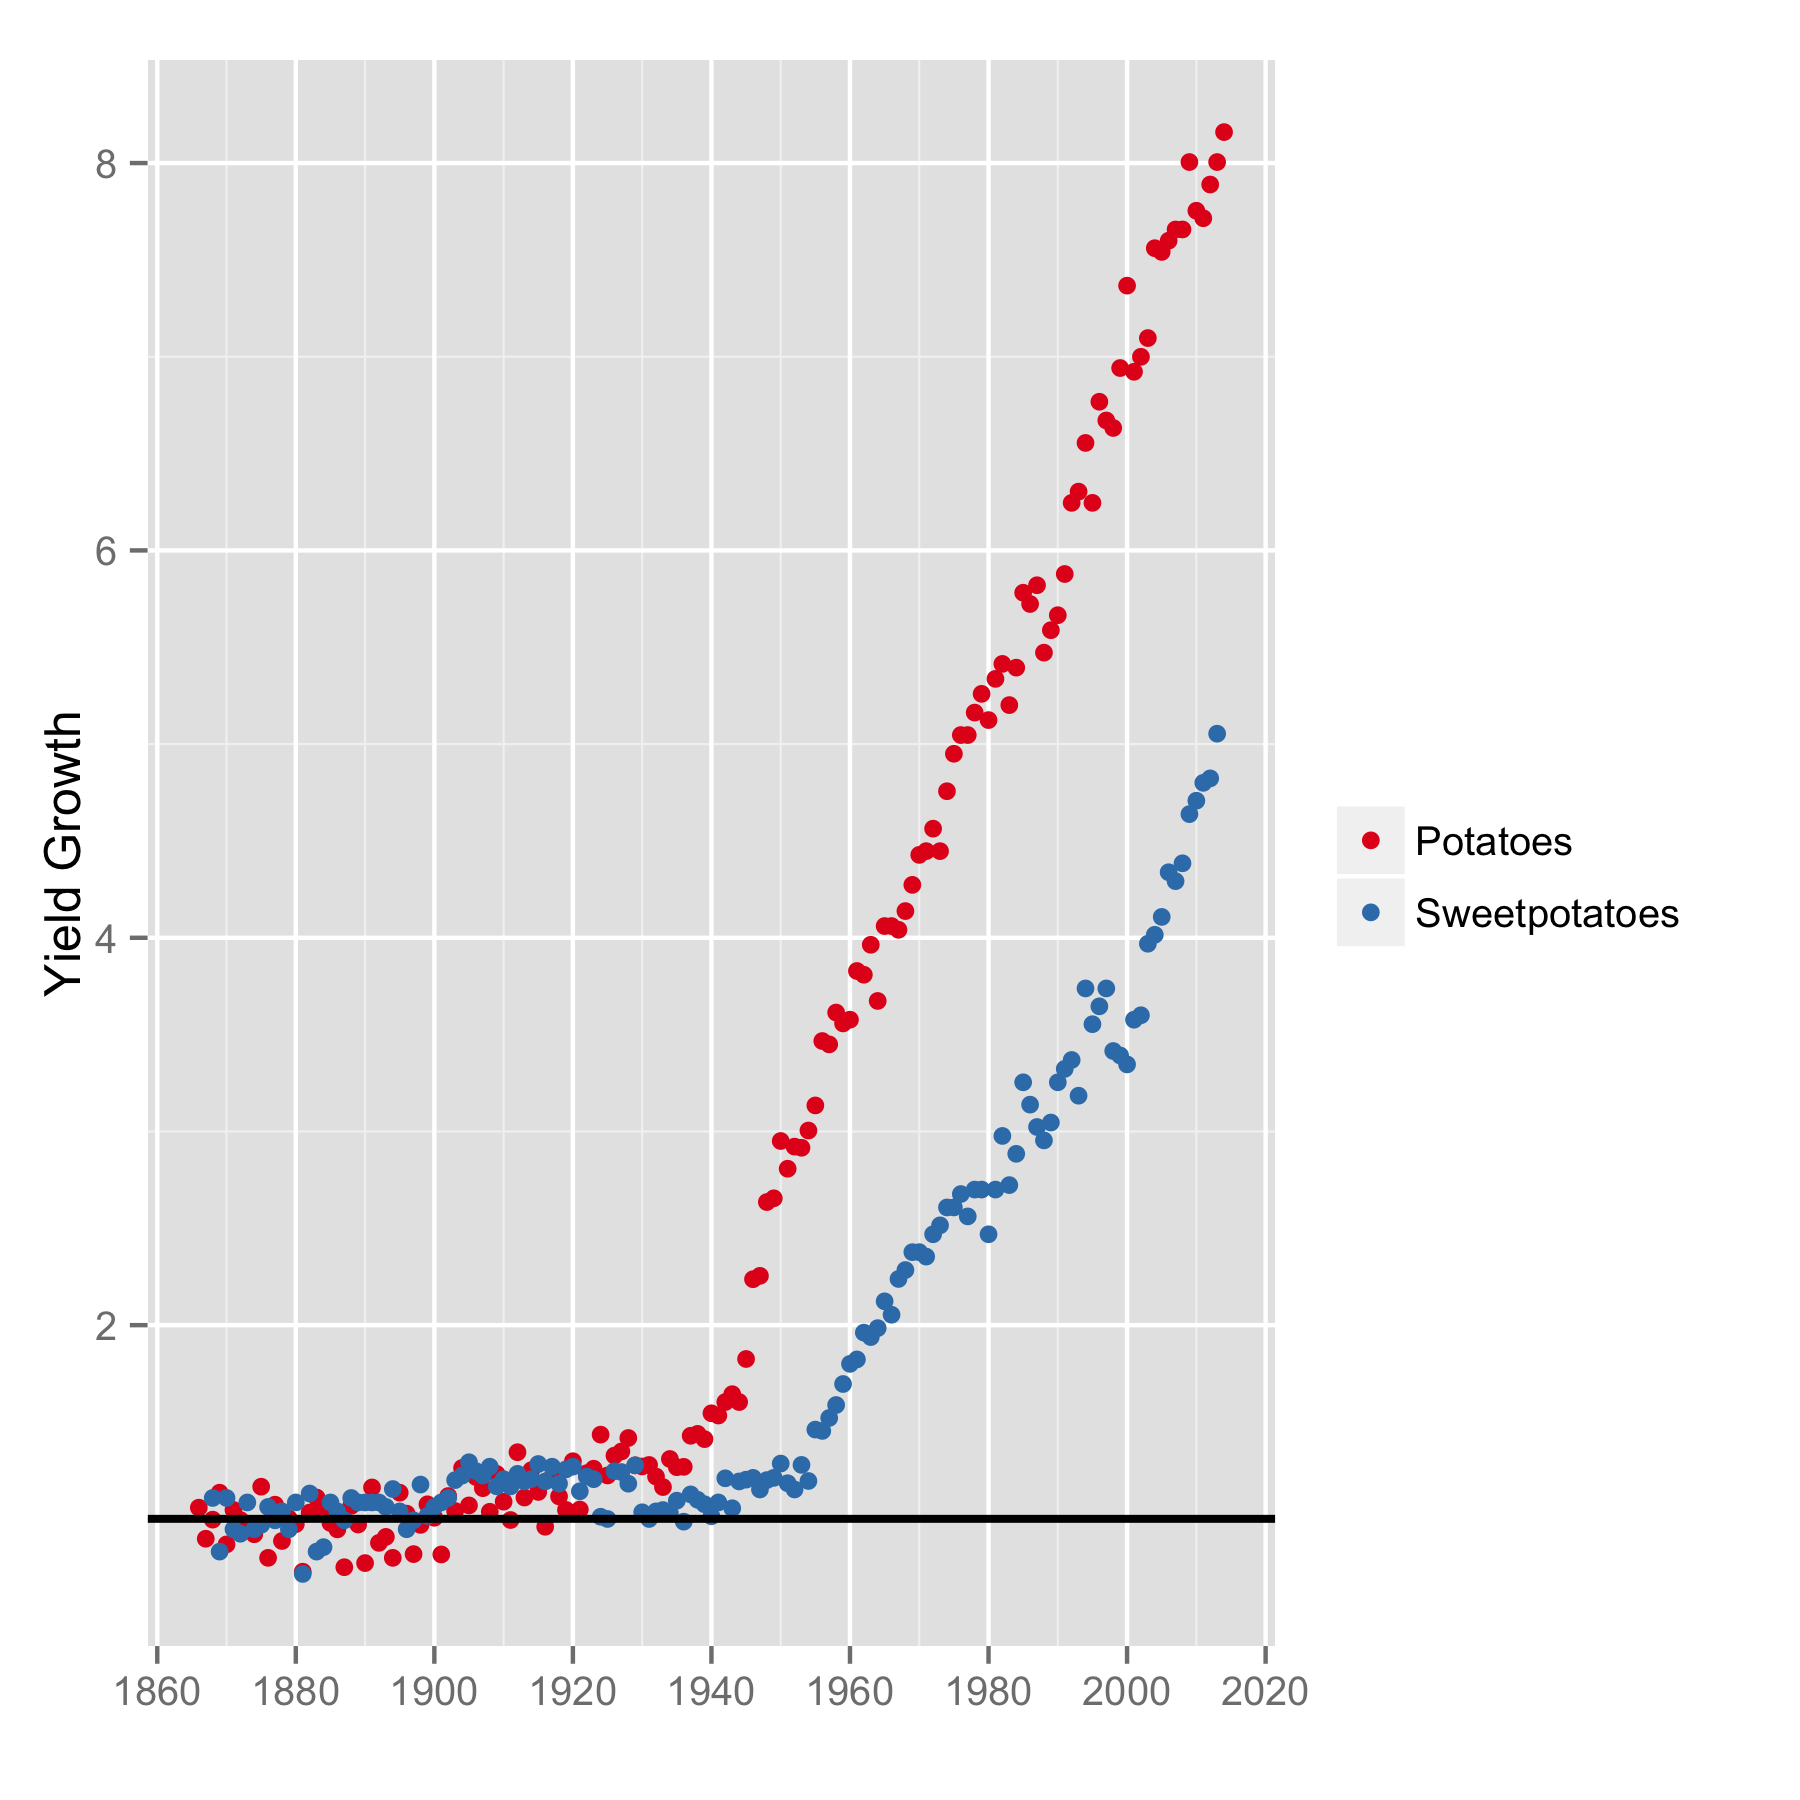
Yield growth for Potatoes and Sweet Potatoes (1868-2014).
Explaining this is somewhat of a problem. Every crop we have looked at has shown the same yield curve behavior. But certainly not every crop had a sudden, massive successful hybridization improvement at the same time. And if pesticides and fertilizer were primarily responsible, then why wouldn’t we see a large step change in the yield curve instead of steady incremental growth? We do know that the tractor and other mechanized equipment came to popular use in the 1930s, but isolating its impact on crop yields is difficult.
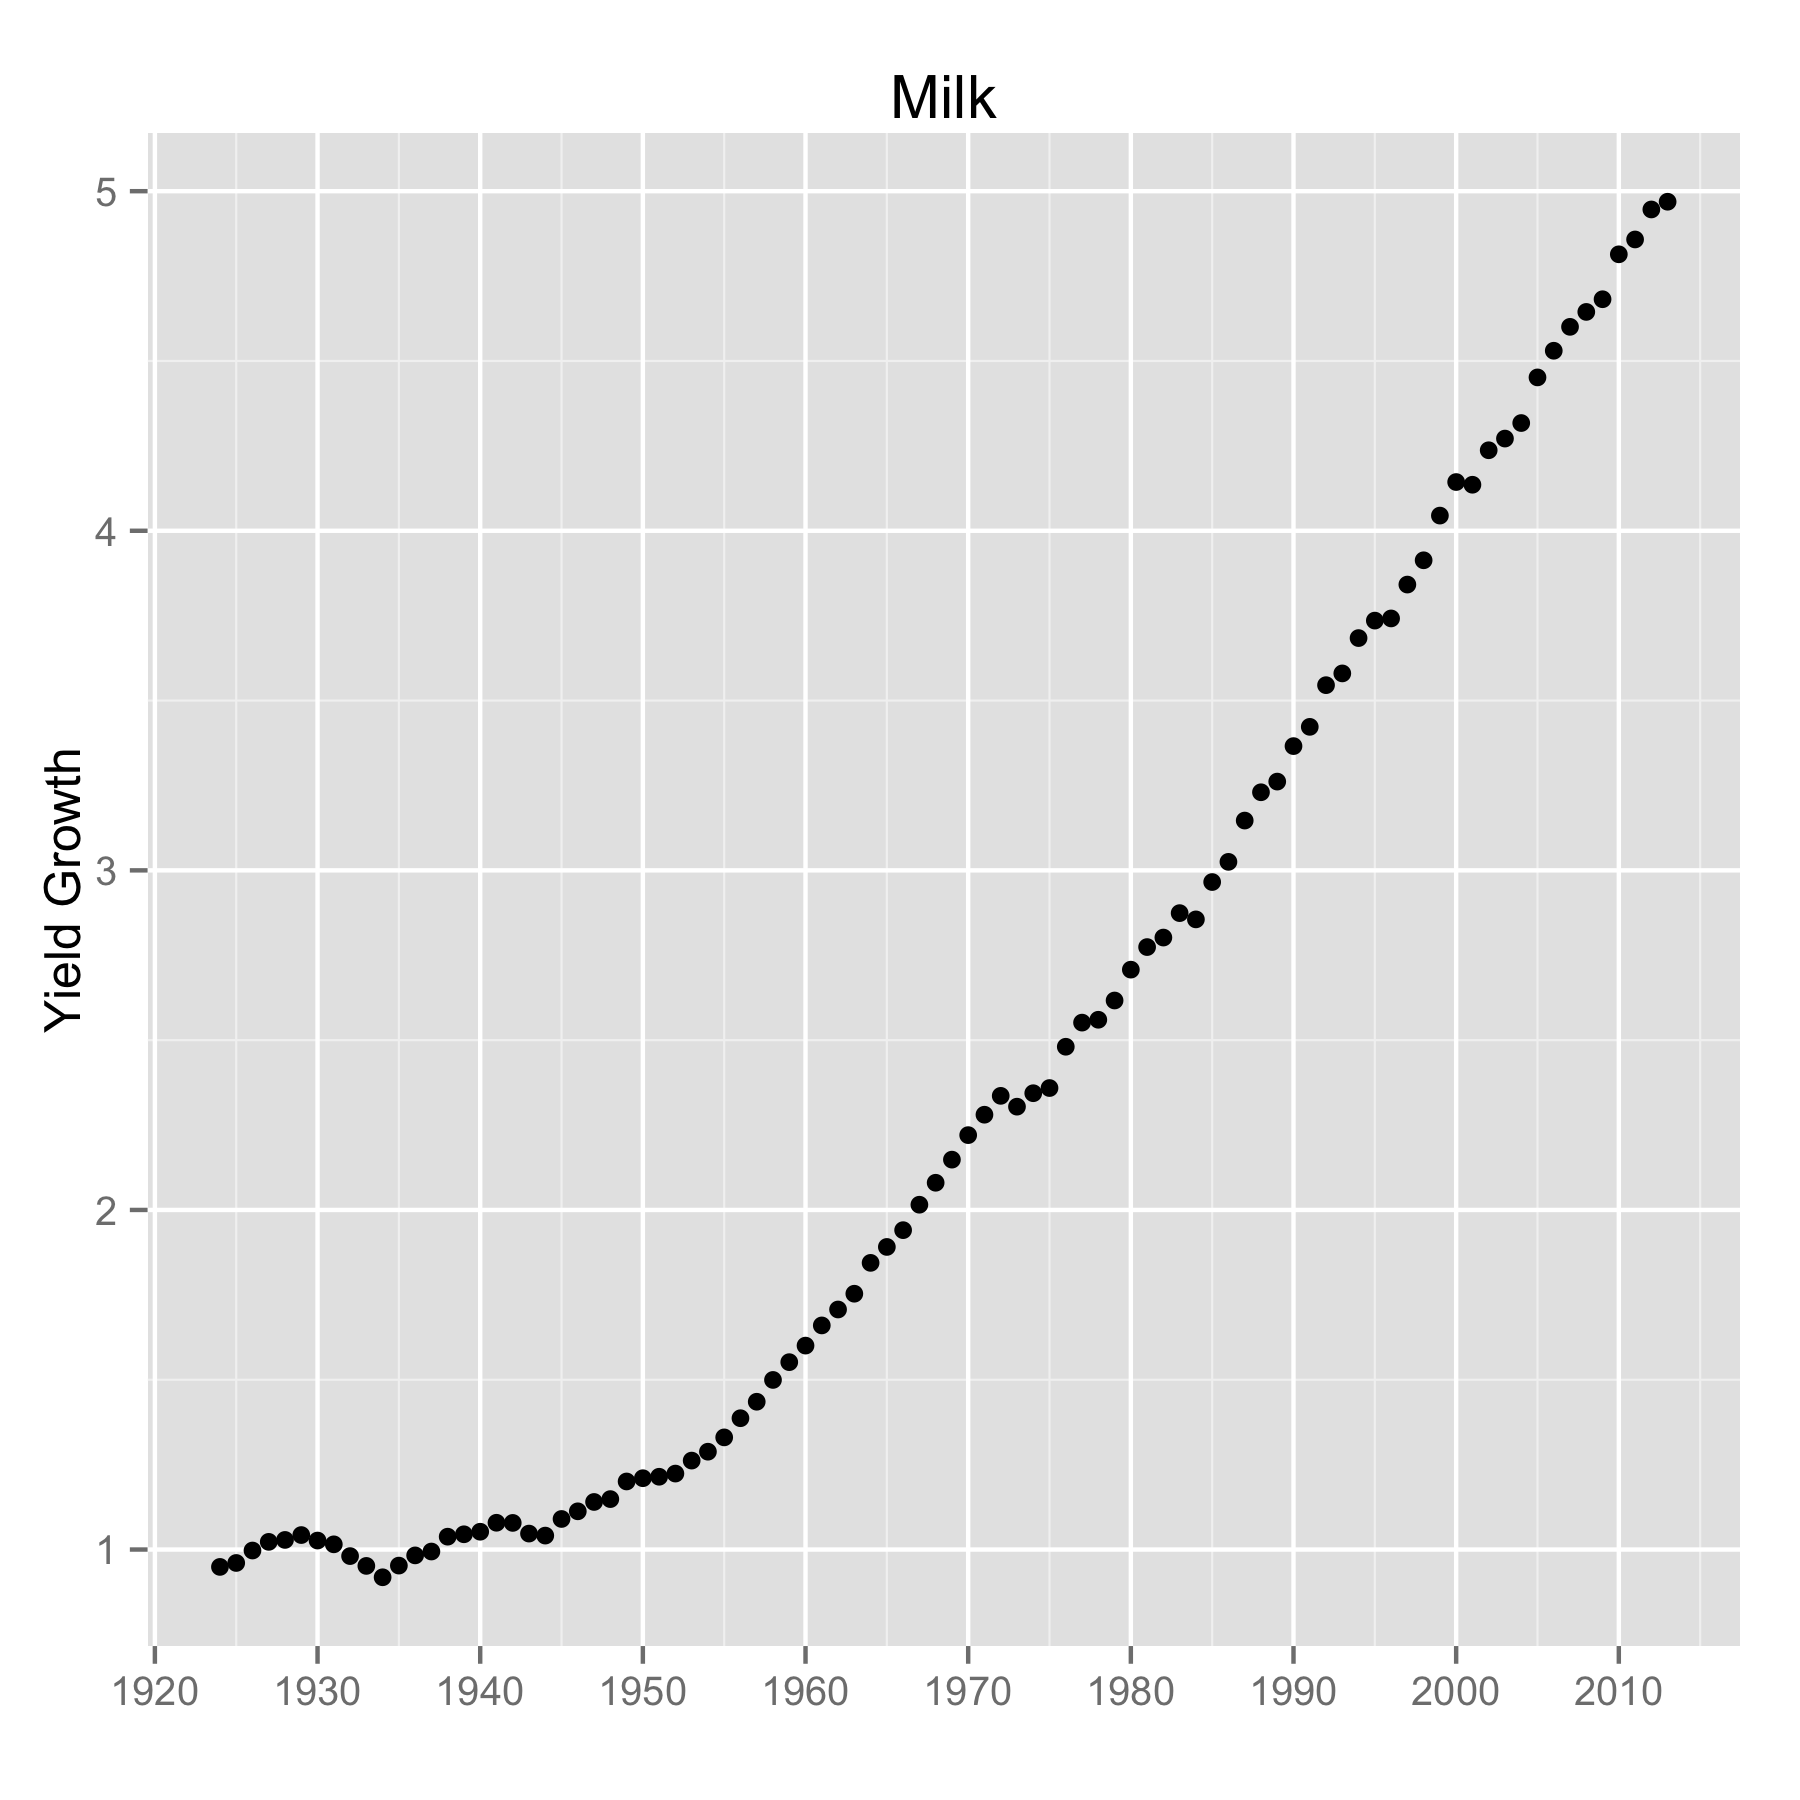
To understand the effect of mechanization, we have to look at something else. We have to look at a product that doesn’t rely on fertilizers or pesticides. We have to look at an agricultural product where hybrid seed isn’t a factor. We have to look at a product where mechanization is the primary driver of yield growth. We have to look at milk.

Milk yield in lbs/head from 1924-2014.
And milk shows the exact same behavior. In 2014, a single dairy cow in the United States could be expected to produce close to 22,000 pounds of milk in a year. That is no small feat considering that the same cow was producing only about one-fifth of that at just over 4,000 pounds annually in 1924. (Well not the same cow…) This suggests that mechanization, and the knowledge behind it, has been the primary driving factor in the increase in farm productivity over the last 70 years.
Milk yield growth from 1924-2014.
And by knowledge I mean that it isn’t enough to make a milking system that pumps faster or has larger storage tanks to increase the time between handling. Today’s automated milking systems enable a cow to decide when she needs to be milked to enter a milking stall and have the system automatically attach and begin. This is an interesting video. I don’t know the language, but it shows we are a far cry from a three-legged stool and a bucket.
Now you might say, “Not so fast! The dairy industry gives cows hormones to increase milk production!” And while there is an element of truth there, it doesn’t explain what we see in the yield. In the 1930s it was found that Bovine Growth Hormone (BGH, also bovine somatotropin, or BST) boosted milk production. But to get BGH they had to extract it from the pituitary glands of cow cadavers, so it wasn’t able to be widely used. It wasn’t until the 1970s that the gene for producing it was identified. Recombinant bovine somatotropin (rBST) didn’t receive FDA approval for usage until 1983, and wasn’t commercially available until 1994. It also isn’t clear that it has always made great economic sense, and adoption has been less than commercial producer expectations, at least at times. So hormones can’t explain this observation.
This takes us back to mechanization. Knowledge, ingenuity, and the desire to improve have lead us to build equipment to do the job better on the farm. Better tractors, seed planters, harvesters, milkers, irrigation systems, and so on have allowed us to do more with less. And the most interesting thing of it all is that in most of the data that we’ve seen, there is no leveling off in sight. We haven’t hit the maximum yet; production yields continue to increase each year, on average.
Predicting the future is hard, but it is very easy to look backward in time to see how we got to where we are today. I don’t imagine a farmer alive in the 1920s would ever have imagined that it would be possible to be getting the production levels we are getting today. Likewise, today it seems impossible that these numbers can continue to increase for another seven decades. In spite of that, I’m going to bet on the impossible coming to reality when it comes to feeding America.
