The other day I went to the grocery store to get some things to make tacos. We often end up getting ground turkey these days, but I admit to preferring ground beef for this sort of thing. But after I looked at the prices of ground beef, I believe I understand why we usually get turkey. In case you haven’t noticed, the price for ground beef is on the rise, having crossed $4/lb in August of 2014 with no looking back. This perplexes me somewhat as ground beef comes from cows, which are not dangerous, rare, or hard to kill. Oh, for the cheap ground beef days of the 1980s, right?
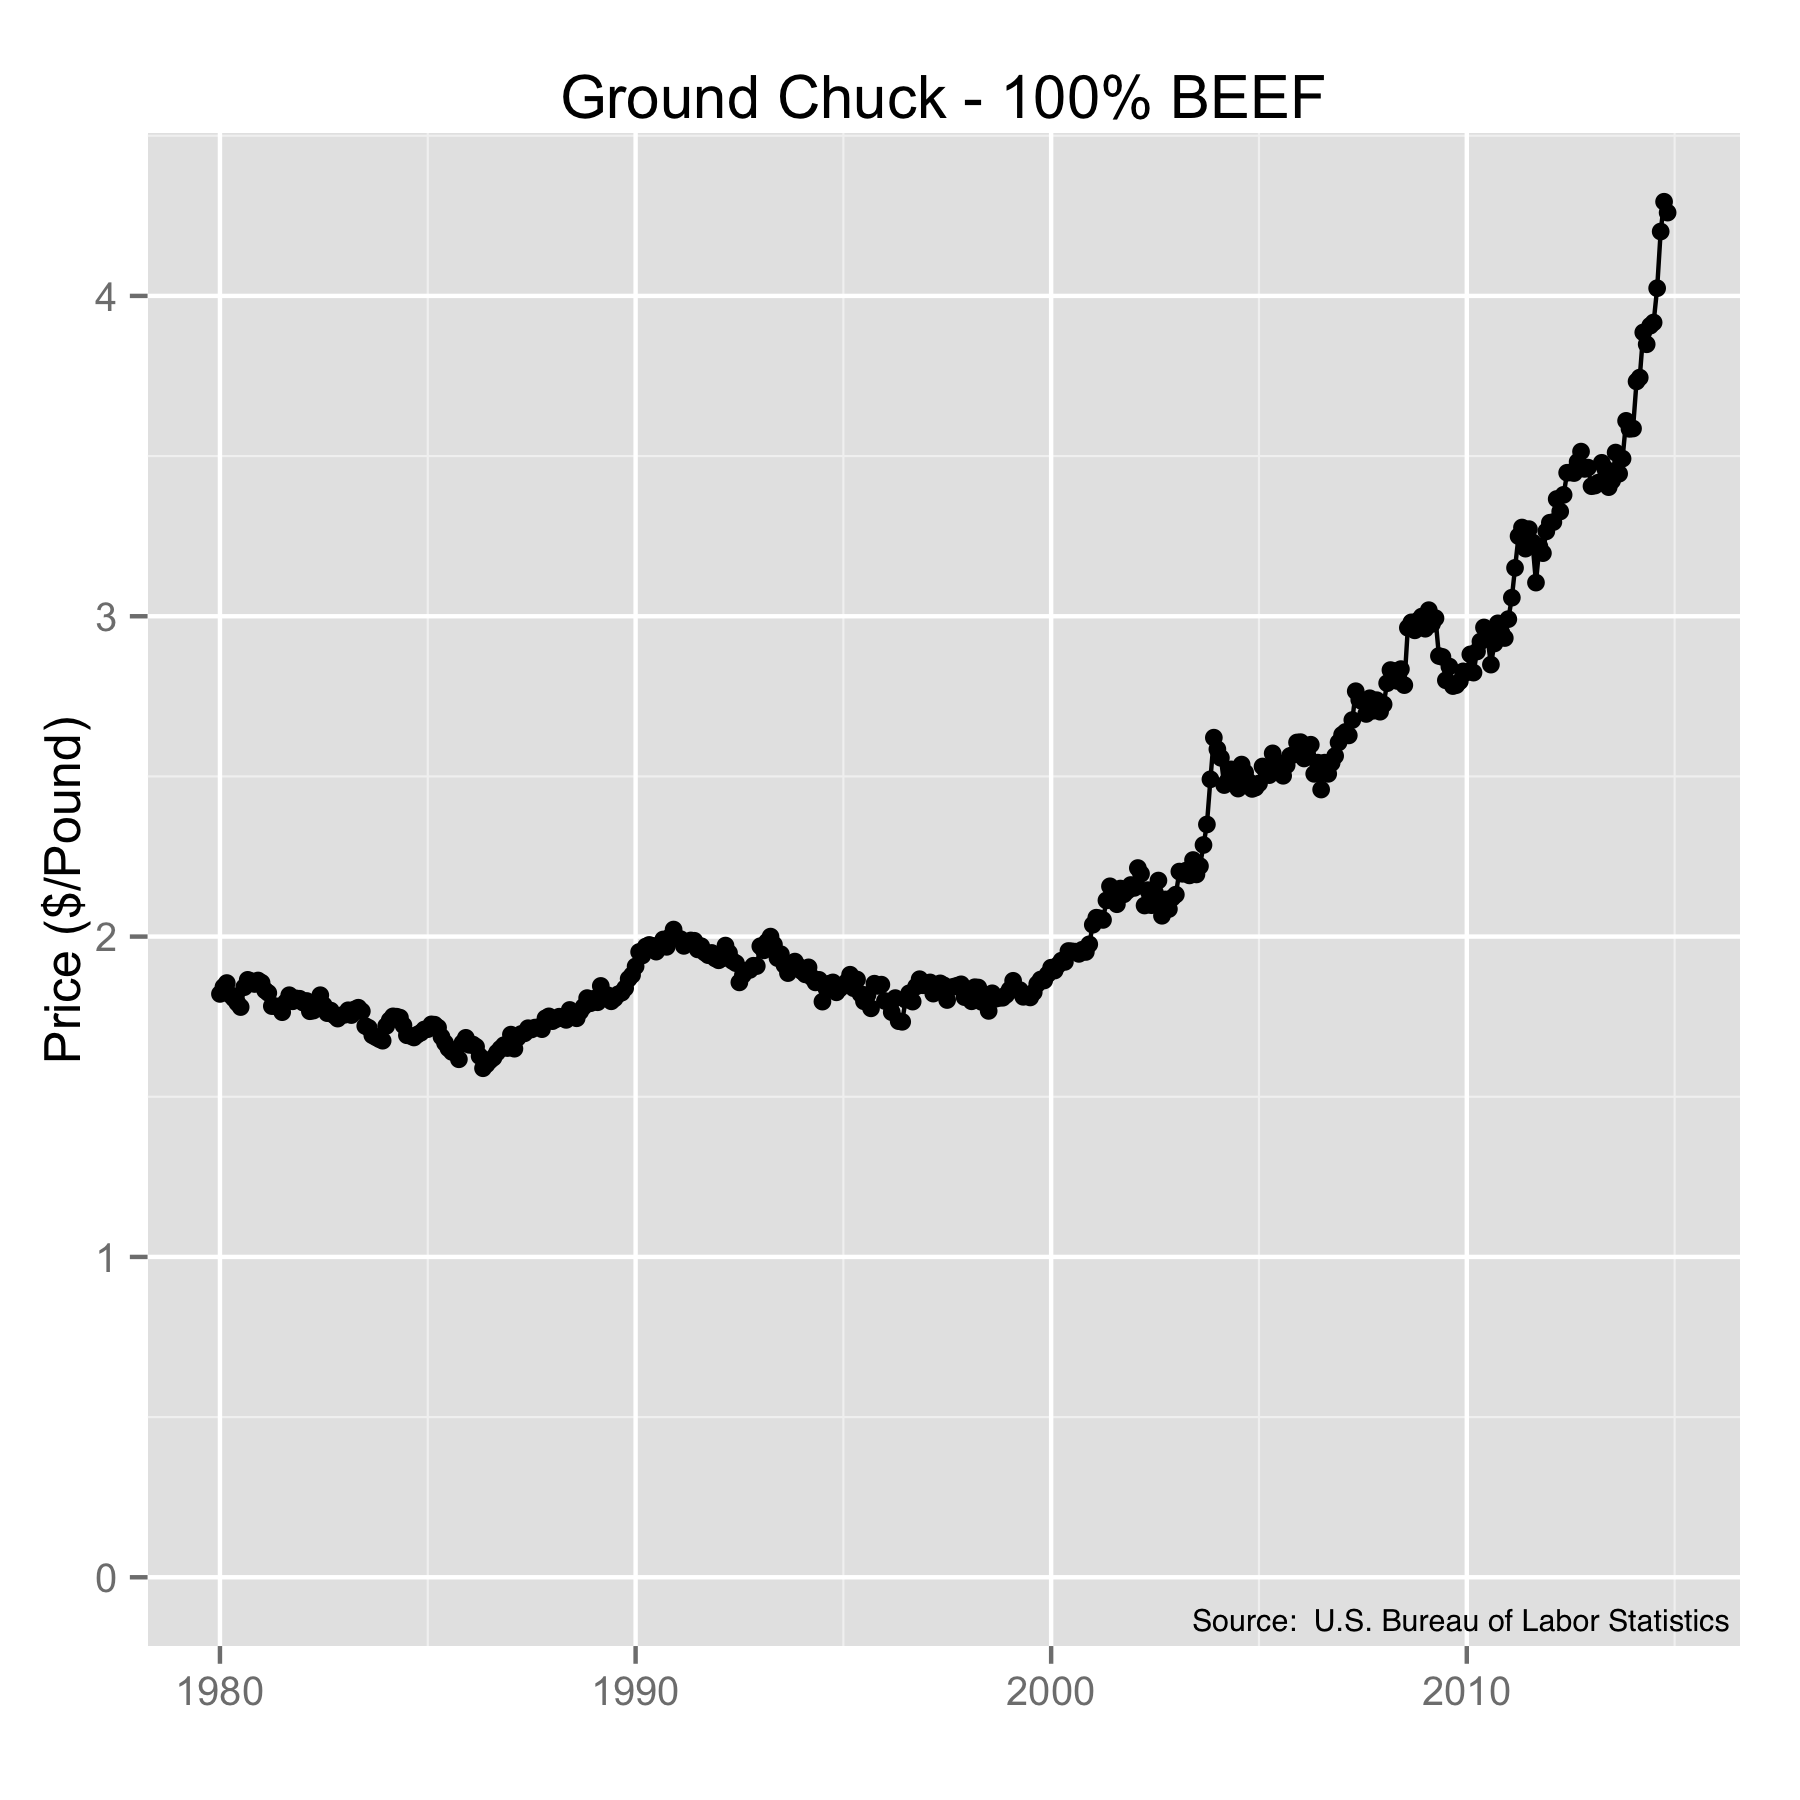
Average U.S. prices for ground chuck (100% Beef) from 1980 to 2014. Source: U.S. Bureau of Labor Statistics.
Now any time you want to compare prices over some length of time you run into the same problem. The buying power of the dollar is not constant. It changes over time, and this makes it somewhat difficult to tell whether something is getting more or less expensive or if the buying power of the dollar is changing. Or both. The folks at the U.S. Bureau of Labor Statistics track the buying power of the dollar each month by finding out what it costs to purchase a basket of particular items in the marketplace. The result of their work is called the Consumer Price Index, or CPI. So whether the cost of something actually changes depends on how it changes compared with the index. To see this, we use the index to adjust past prices to reflect what they would have been if the dollar had kept a constant buying power.
This method isn’t perfect because it only reflects the buying power of the dollar at some point in time and doesn’t directly consider the change in the money supply. You might have thought that the amount of money in the U.S. economy was a fixed number, and that would be a reasonable assumption. But it would be a very wrong assumption. An increase in the money supply will decrease buying power but takes some time to be recognized by the market. Because of this, the CPI will lag somewhat behind actual values. In any case, we won’t let perfection be the enemy of good enough.
In order to use the CPI to compare historic prices, we pick a year and normalize everything with respect to that year’s value. Below is a plot of the CPI using 2008 as the reference year (where the CPI = 1). To use the chart, we can look and see that in 1985 the CPI was one-half, and this indicates that prices doubled between 1985 and 2008. Specifically, this means that the prices of the things in the BLS’s market basket doubled. That’s another way of saying the buying power of the dollar was cut in half in that time period. So much for your savings.
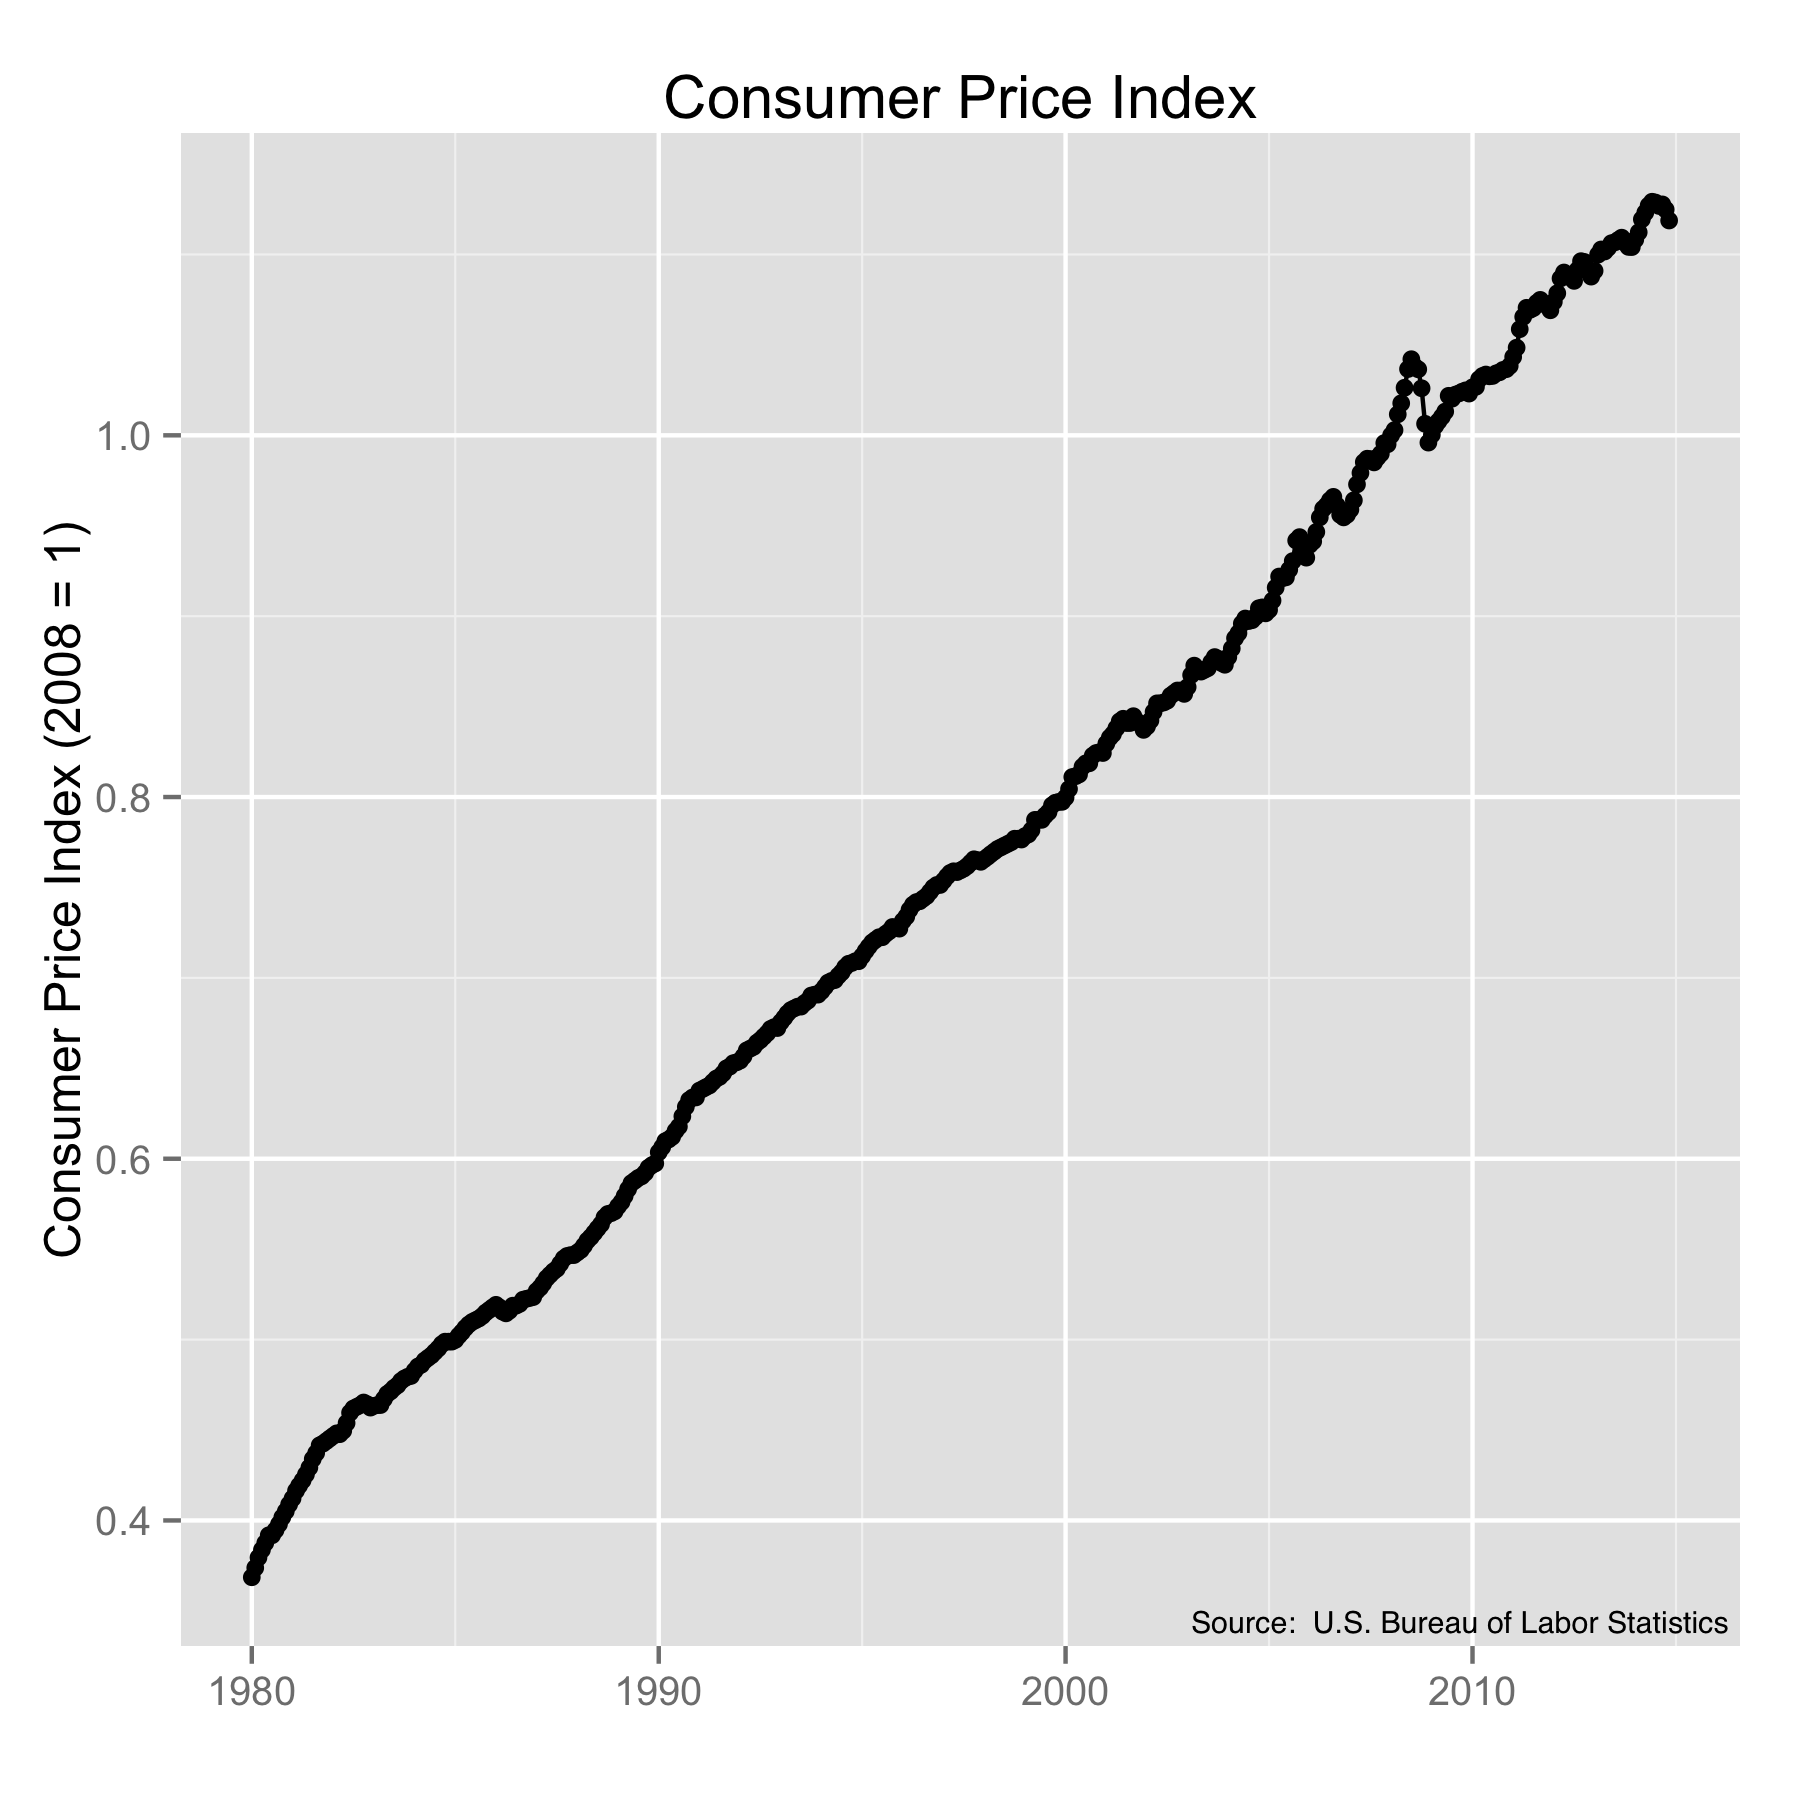
Consumer Price Index (CPI) from 1980 to 2014, using 2008 as the reference.
With this information in hand, we can have another look at the prices of ground beef in constant dollars. And now we see that the cost of ground beef was surprisingly high in the 1980s but decreased until about 2000. It then started its way up sharply around the middle of 2013 leading up to today’s prices. So ground beef really is getting more expensive, and by no small amount. Not good for taco lovers who prefer beef to turkey. And before you ask, they don’t track ground turkey prices, and I don’t know why.
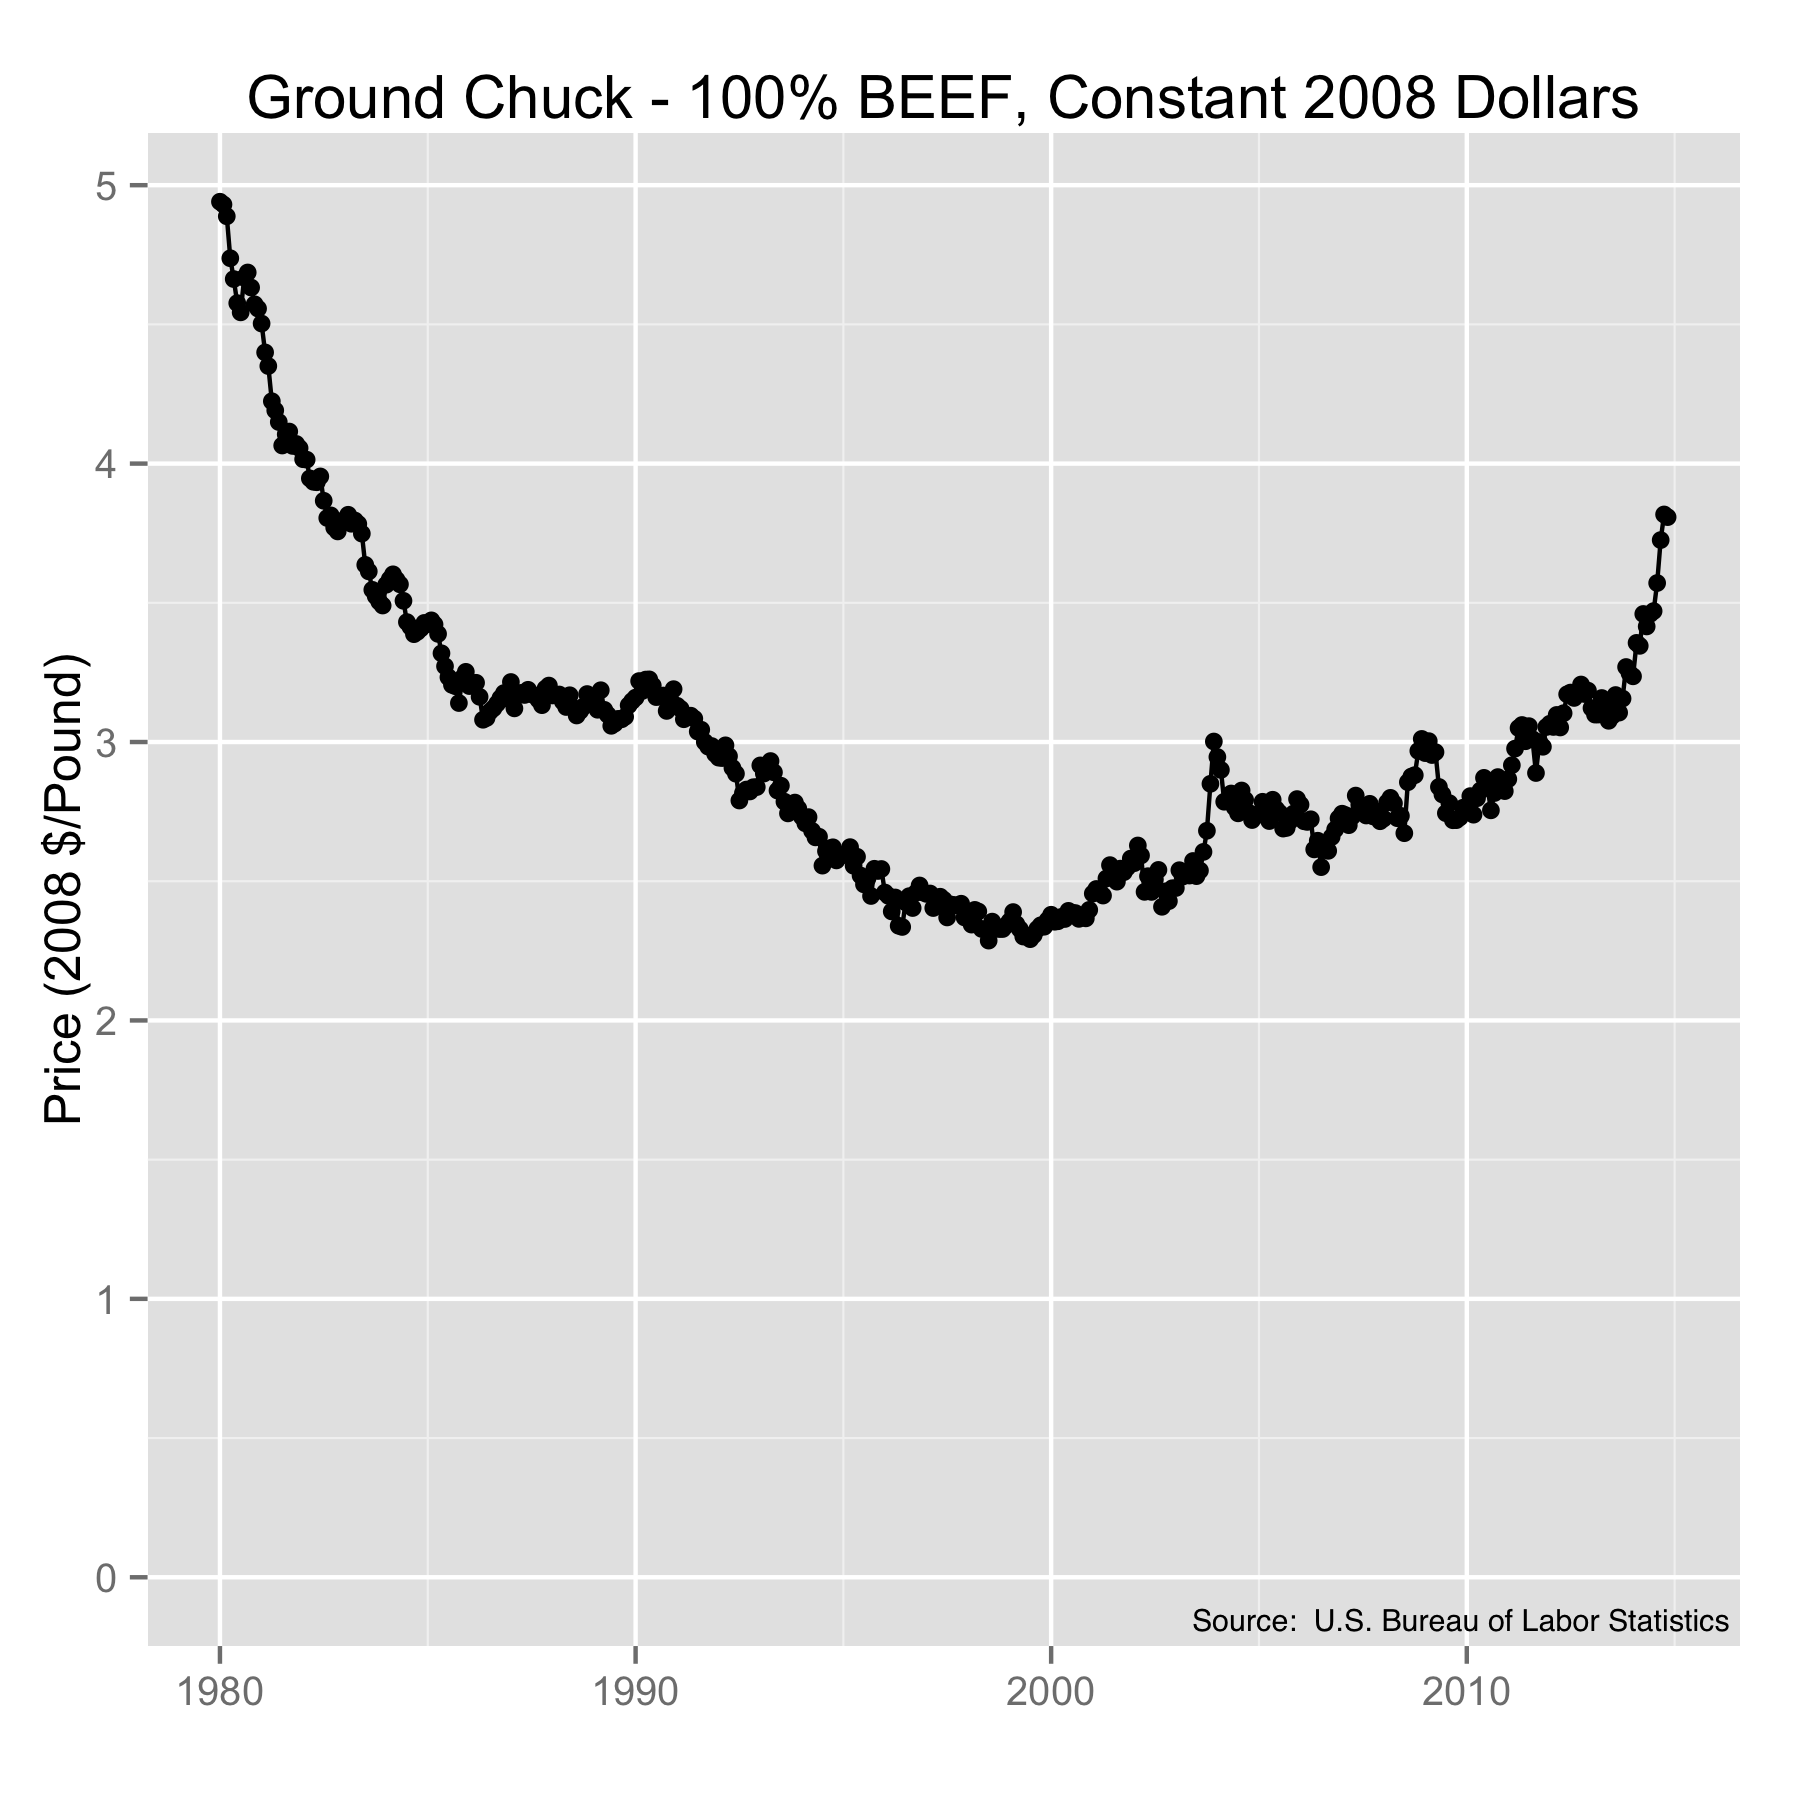
Historic pricing of ground chuck in the U.S. in constant 2008 dollars. Source: U.S. Bureau of Labor Statistics.
On a side note, who would have ever thought, at the time, that we would look back at the 1980s as the days of the strong dollar?
In any case, the BLS tracks the prices of a lot of other products. We can get a feel for the health of the economy by looking at how the cost of things have changed using constant-valued currency. So let’s continue with food. Specifically, chicken. The inflation adjusted cost of fresh, whole chicken in constant 2008 dollars shows that chicken prices have been stable since about 1990, which means the price at the register has increased at about the rate of inflation. Hopefully your income has as well.
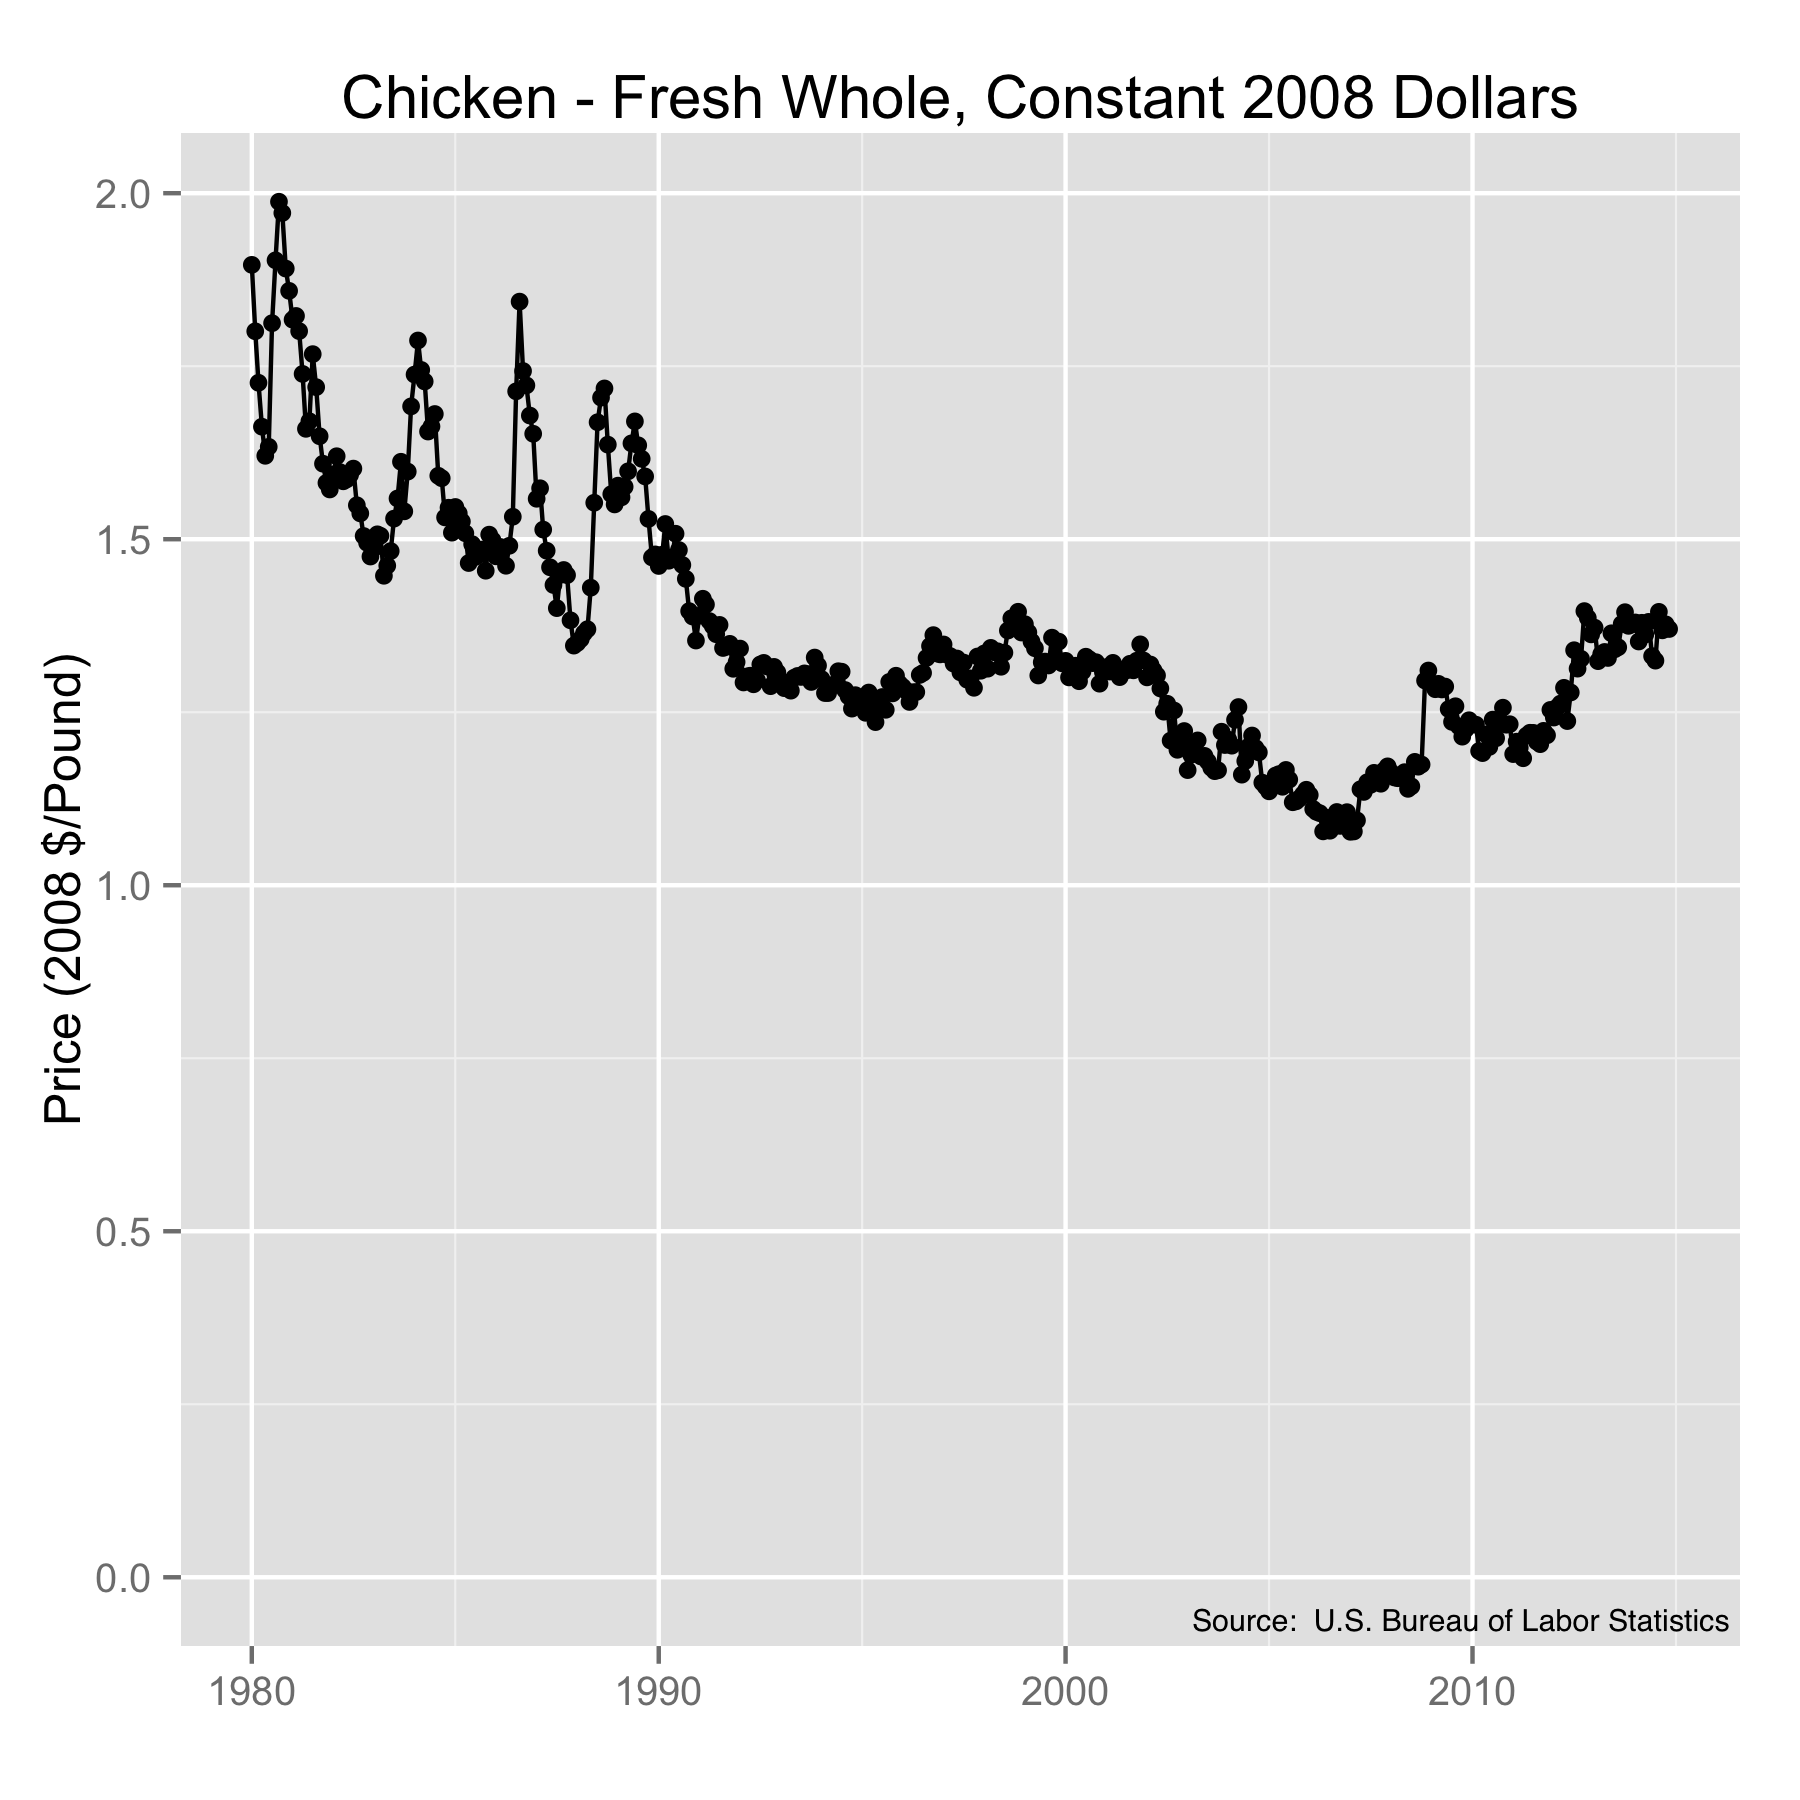
BLS data for U.S. fresh whole chicken prices in constant 2008 dollars. Source: U.S. Bureau of Labor Statistics.
Milk is an interesting product to look at because it one of the items in the BLS market basket that is used to calculate the CPI. Because of this, we should expect the cost of milk to move pretty much in line with the CPI and give us a flat cost curve, which it does—on average. These numbers are nationwide averages, so some fluctuations should be expected. But we also have (or have had in any case) minimum prices federally guaranteed at various times during this period. Meaning there’s no limit to how high milk prices can go, but prices won’t fall below a set value. And if that happens, your tax dollars are used to pay for the milk you didn’t buy in the store.
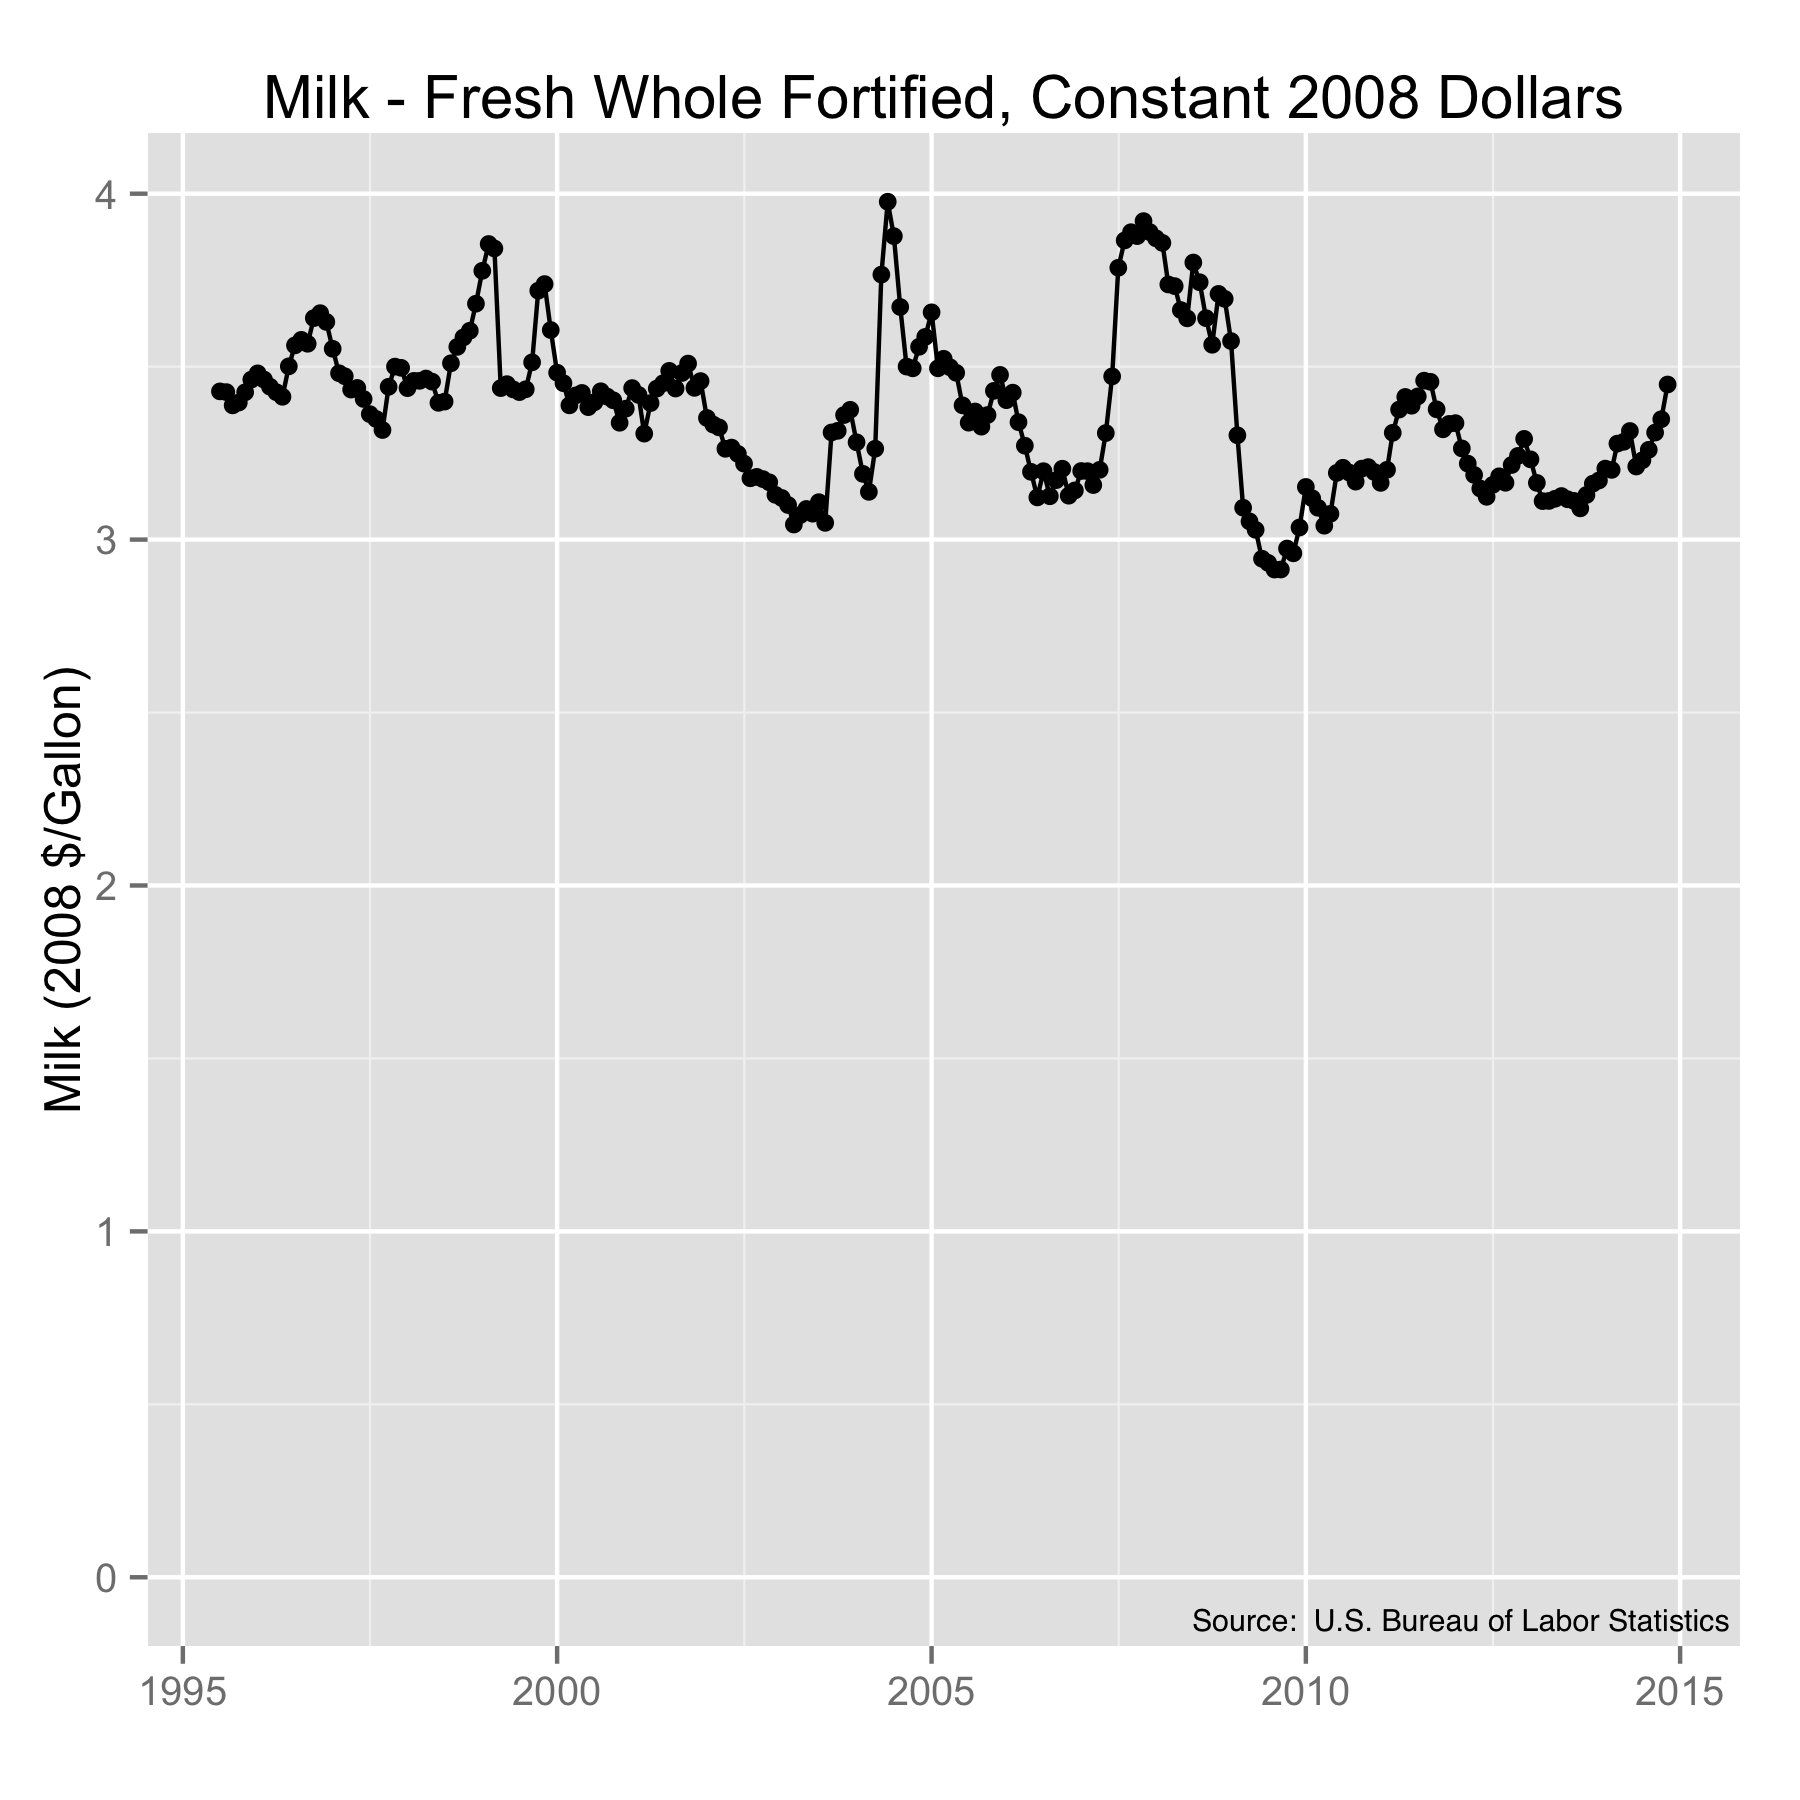
Milk prices from 1980 to 2014 in constant 2008 dollar prices. Source: U.S. Bureau of Labor Statistics.
Sugar is the last of the food products that we’ll look at. Sugar is another one of those agricultural products with price supports, but this one isn’t in the BLS market basket. Interestingly, the supported prices don’t generally adjust in line with inflation. So while the retail price of sugar (not shown) has been largely steady throughout the decades, the inflation-adjusted true cost of it has been coming down. Interestingly, it was the production shortages in 1979 and and 1980 that lead to the soaring prices in the early 1980s that ultimately lead to the switch to high fructose corn syrup (HFCS) by food and beverage companies. Other references show similar or larger spikes in sugar prices in the 1960s and 1970s. It isn’t clear that it was worth it, but sugar hasn’t been quite so volatile since the switch.
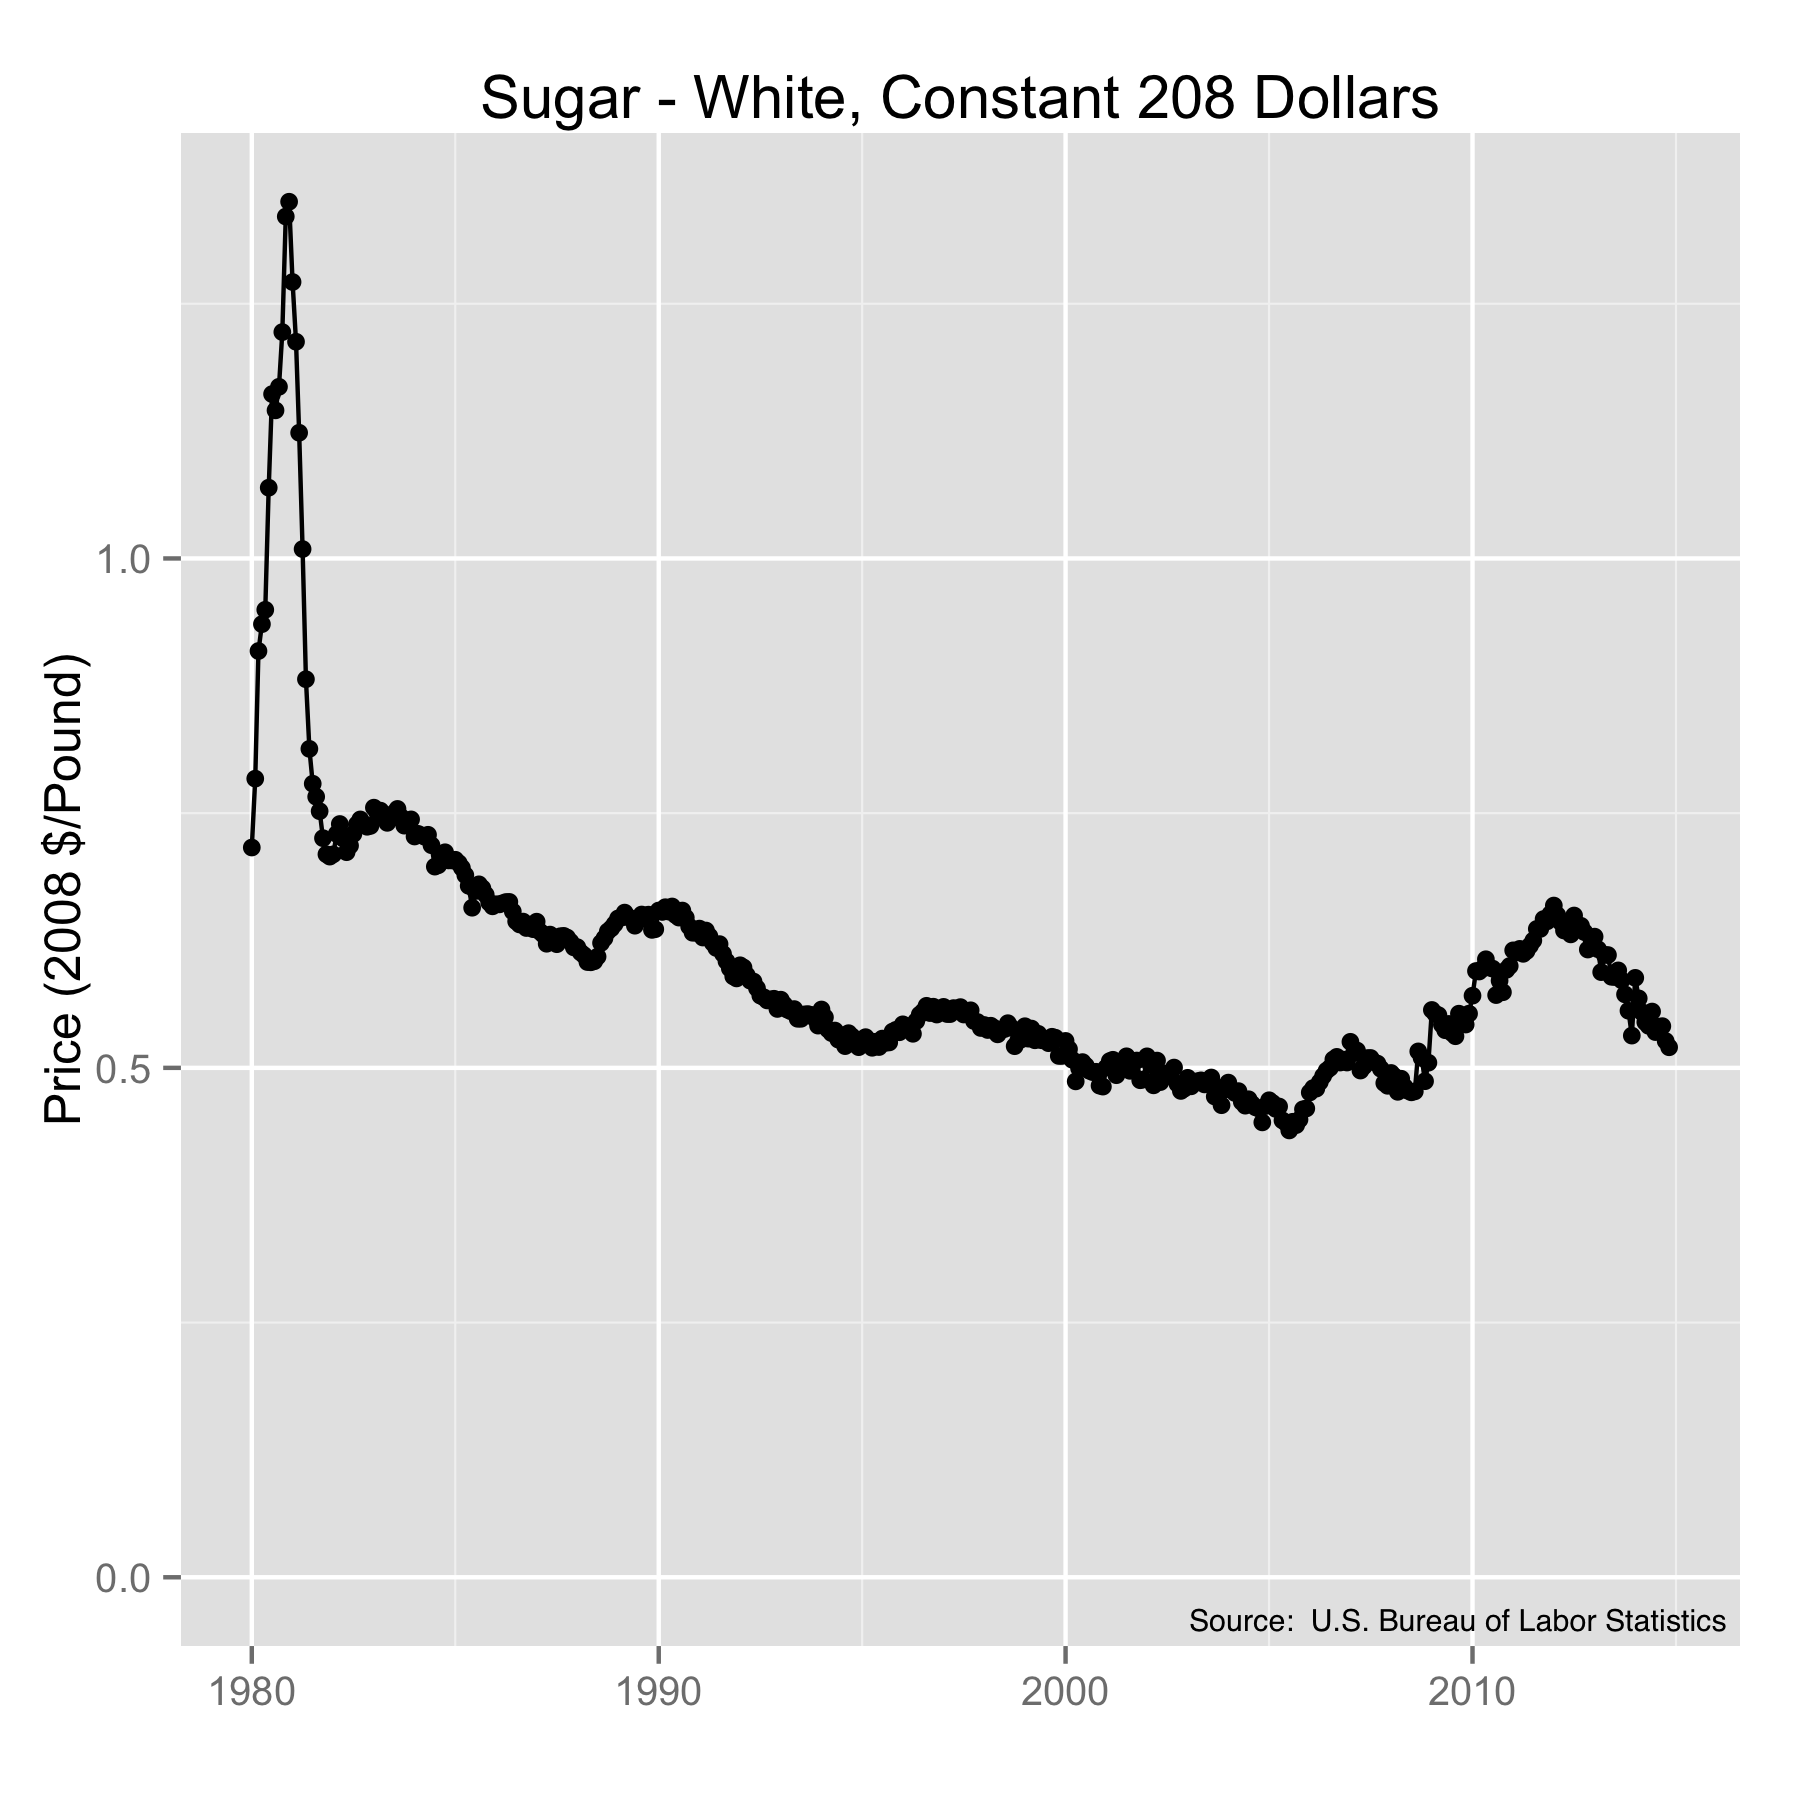
Sugar prices from 1980 to 2014 in constant 2008 dollars. Source: U.S. Bureau of Labor Statistics.
There are some other interesting products to look at. Electricity is one of them. I haven’t seen anything that shows seasonal price fluctuations quite as clearly as the electricity cost chart. What is especially interesting here is that sometimes the retail price (not shown) of electricity increased while the cost in constant dollars came down. Being a regulated public utility, the prices for electricity are generally not market-driven, but based on cost-recovery, so we can read from this that the costs of the electric utility business have been decreasing fairly consistently since the mid 1980s. Here in New England they’re talking about 40% increases in electricity rates in the next year or so, which would take us back to the historically high 1980s costs. There is no historic precedent for that kind of single year price increase. At least, not in the last three decades.
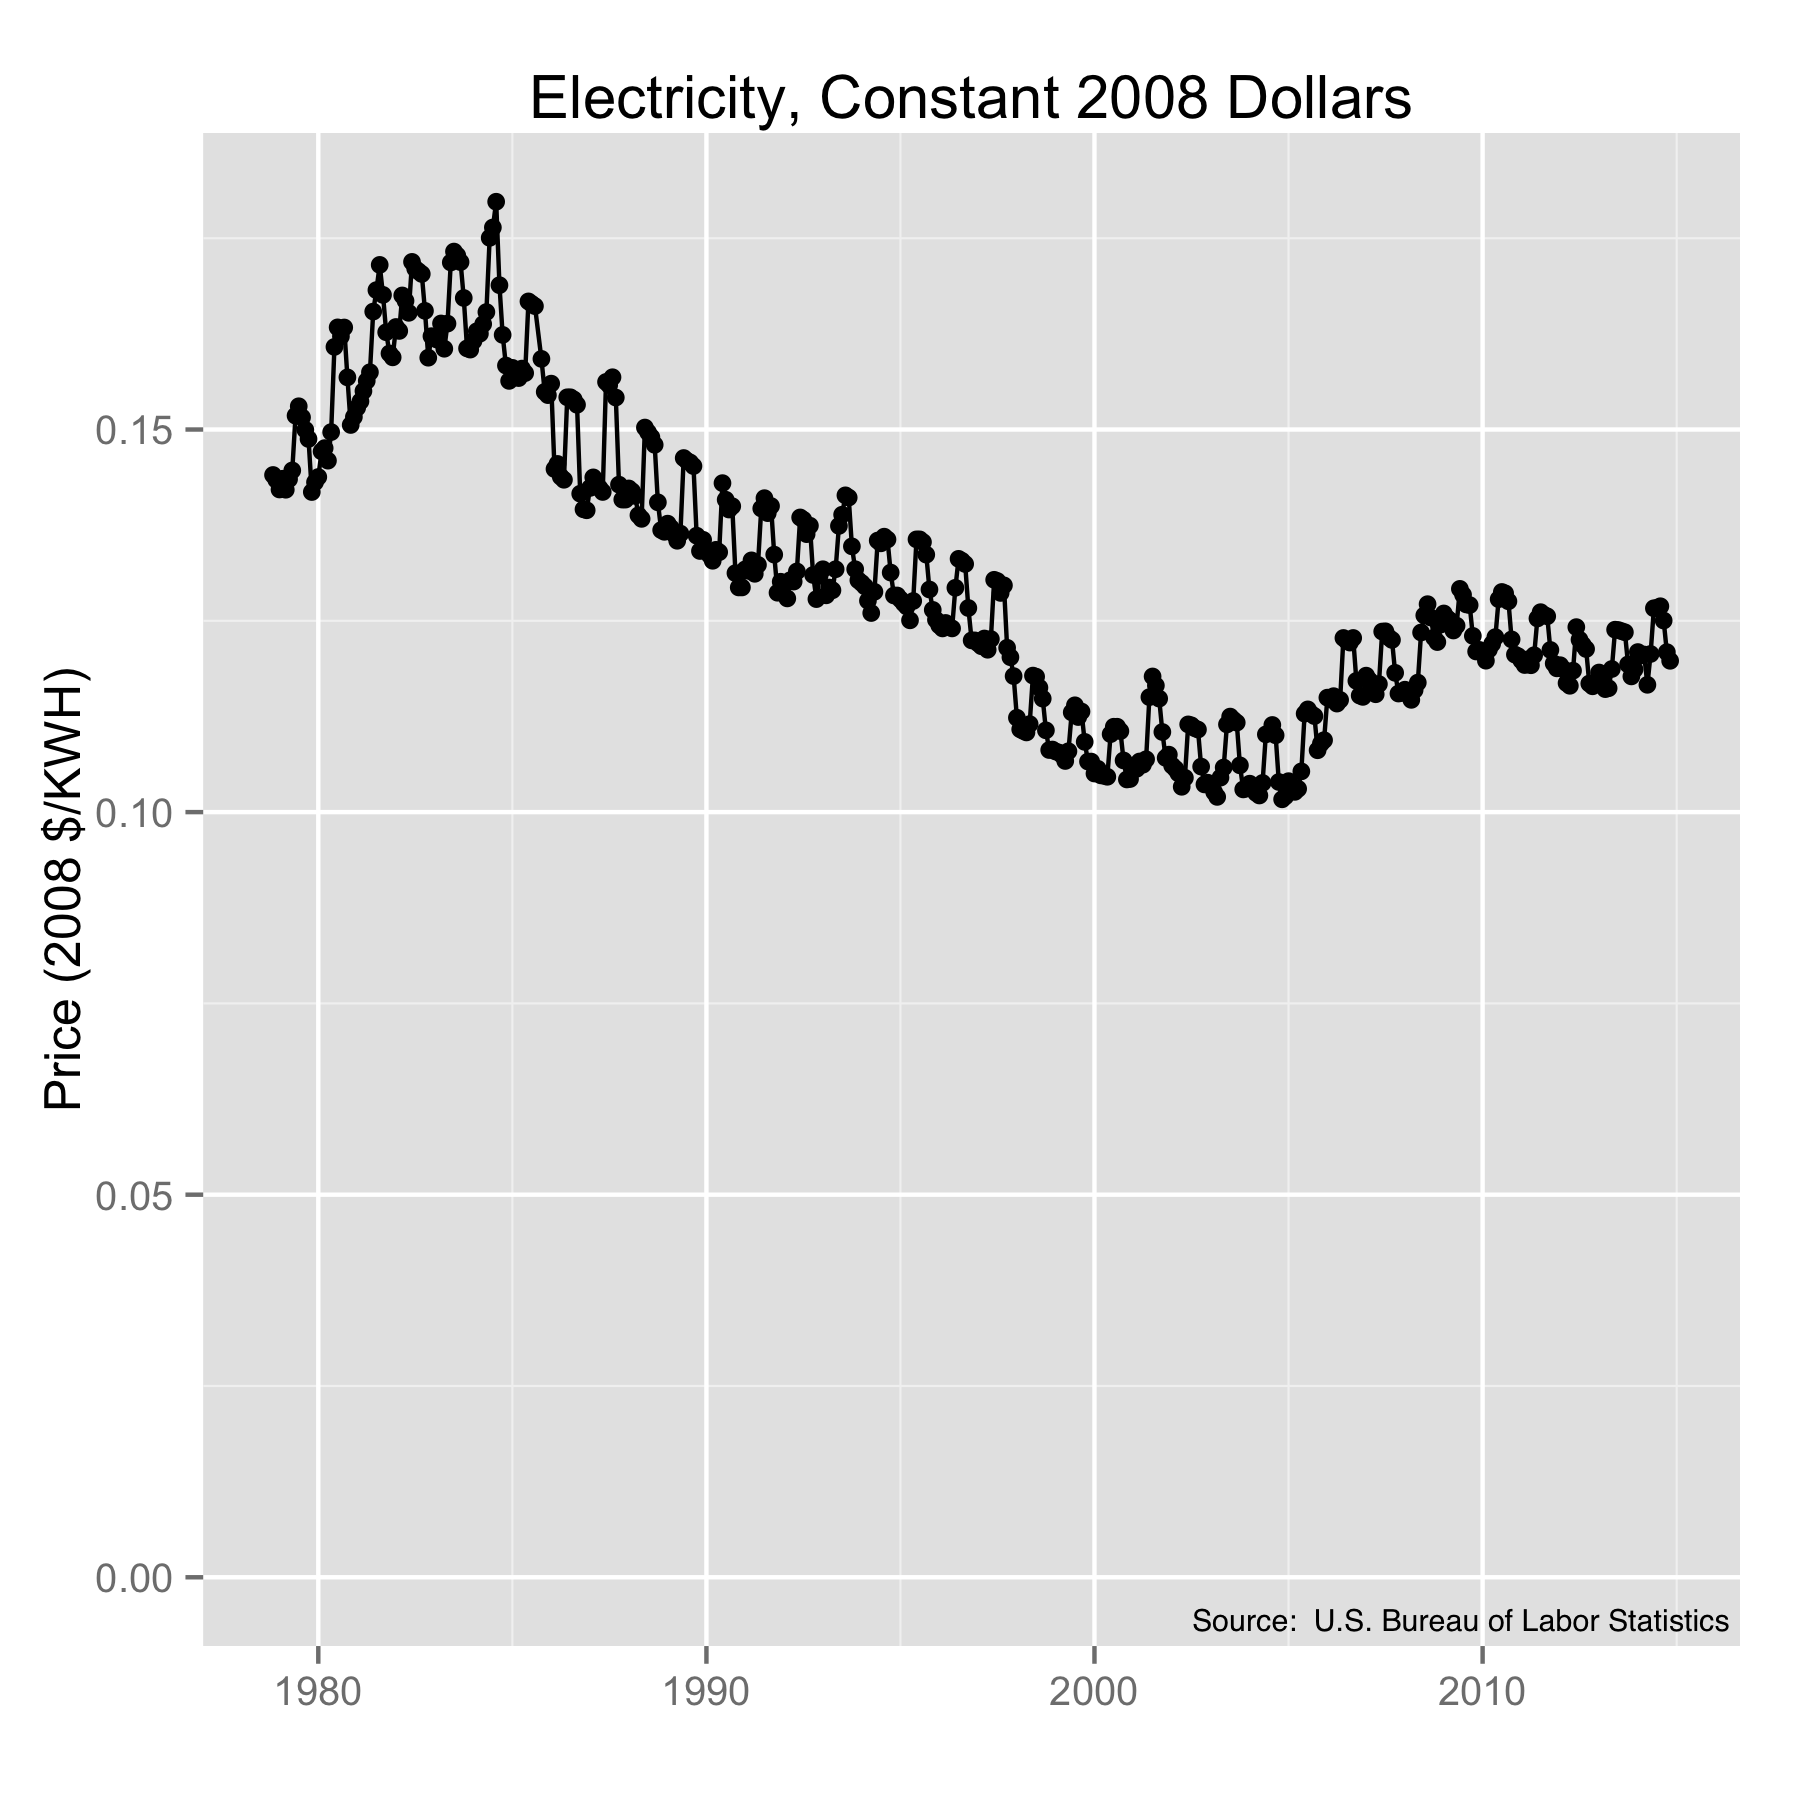
The cost of electricity in the U.S. from 1980 to 2014 in constant 2008 dollars. Source: U.S. Bureau of Labor Statistics.
Since we are on the topic of energy, it makes sense to look at gasoline. Gasoline showed a fairly flat cost curve from the mid 1980s though the early 2000s before it went all to hell. There was a significant correction in late 2008 which is curious. And in spite of the fact that the prices are on the decline, they’re still historically high by around a dollar per gallon. I always hear about how gasoline prices decline in election years. That isn’t clear from this look, so that will be a topic I’ll dig into soon.

Unleaded regular gasoline prices from 1980 to 2014 in constant 2008 dollars. Source: U.S. Bureau of Labor Statistics.
Staying with energy, for those who heat with natural gas, you’ll see that current rates are close to average lows. But costs have clearly been on a roller coaster for the last 15 years.
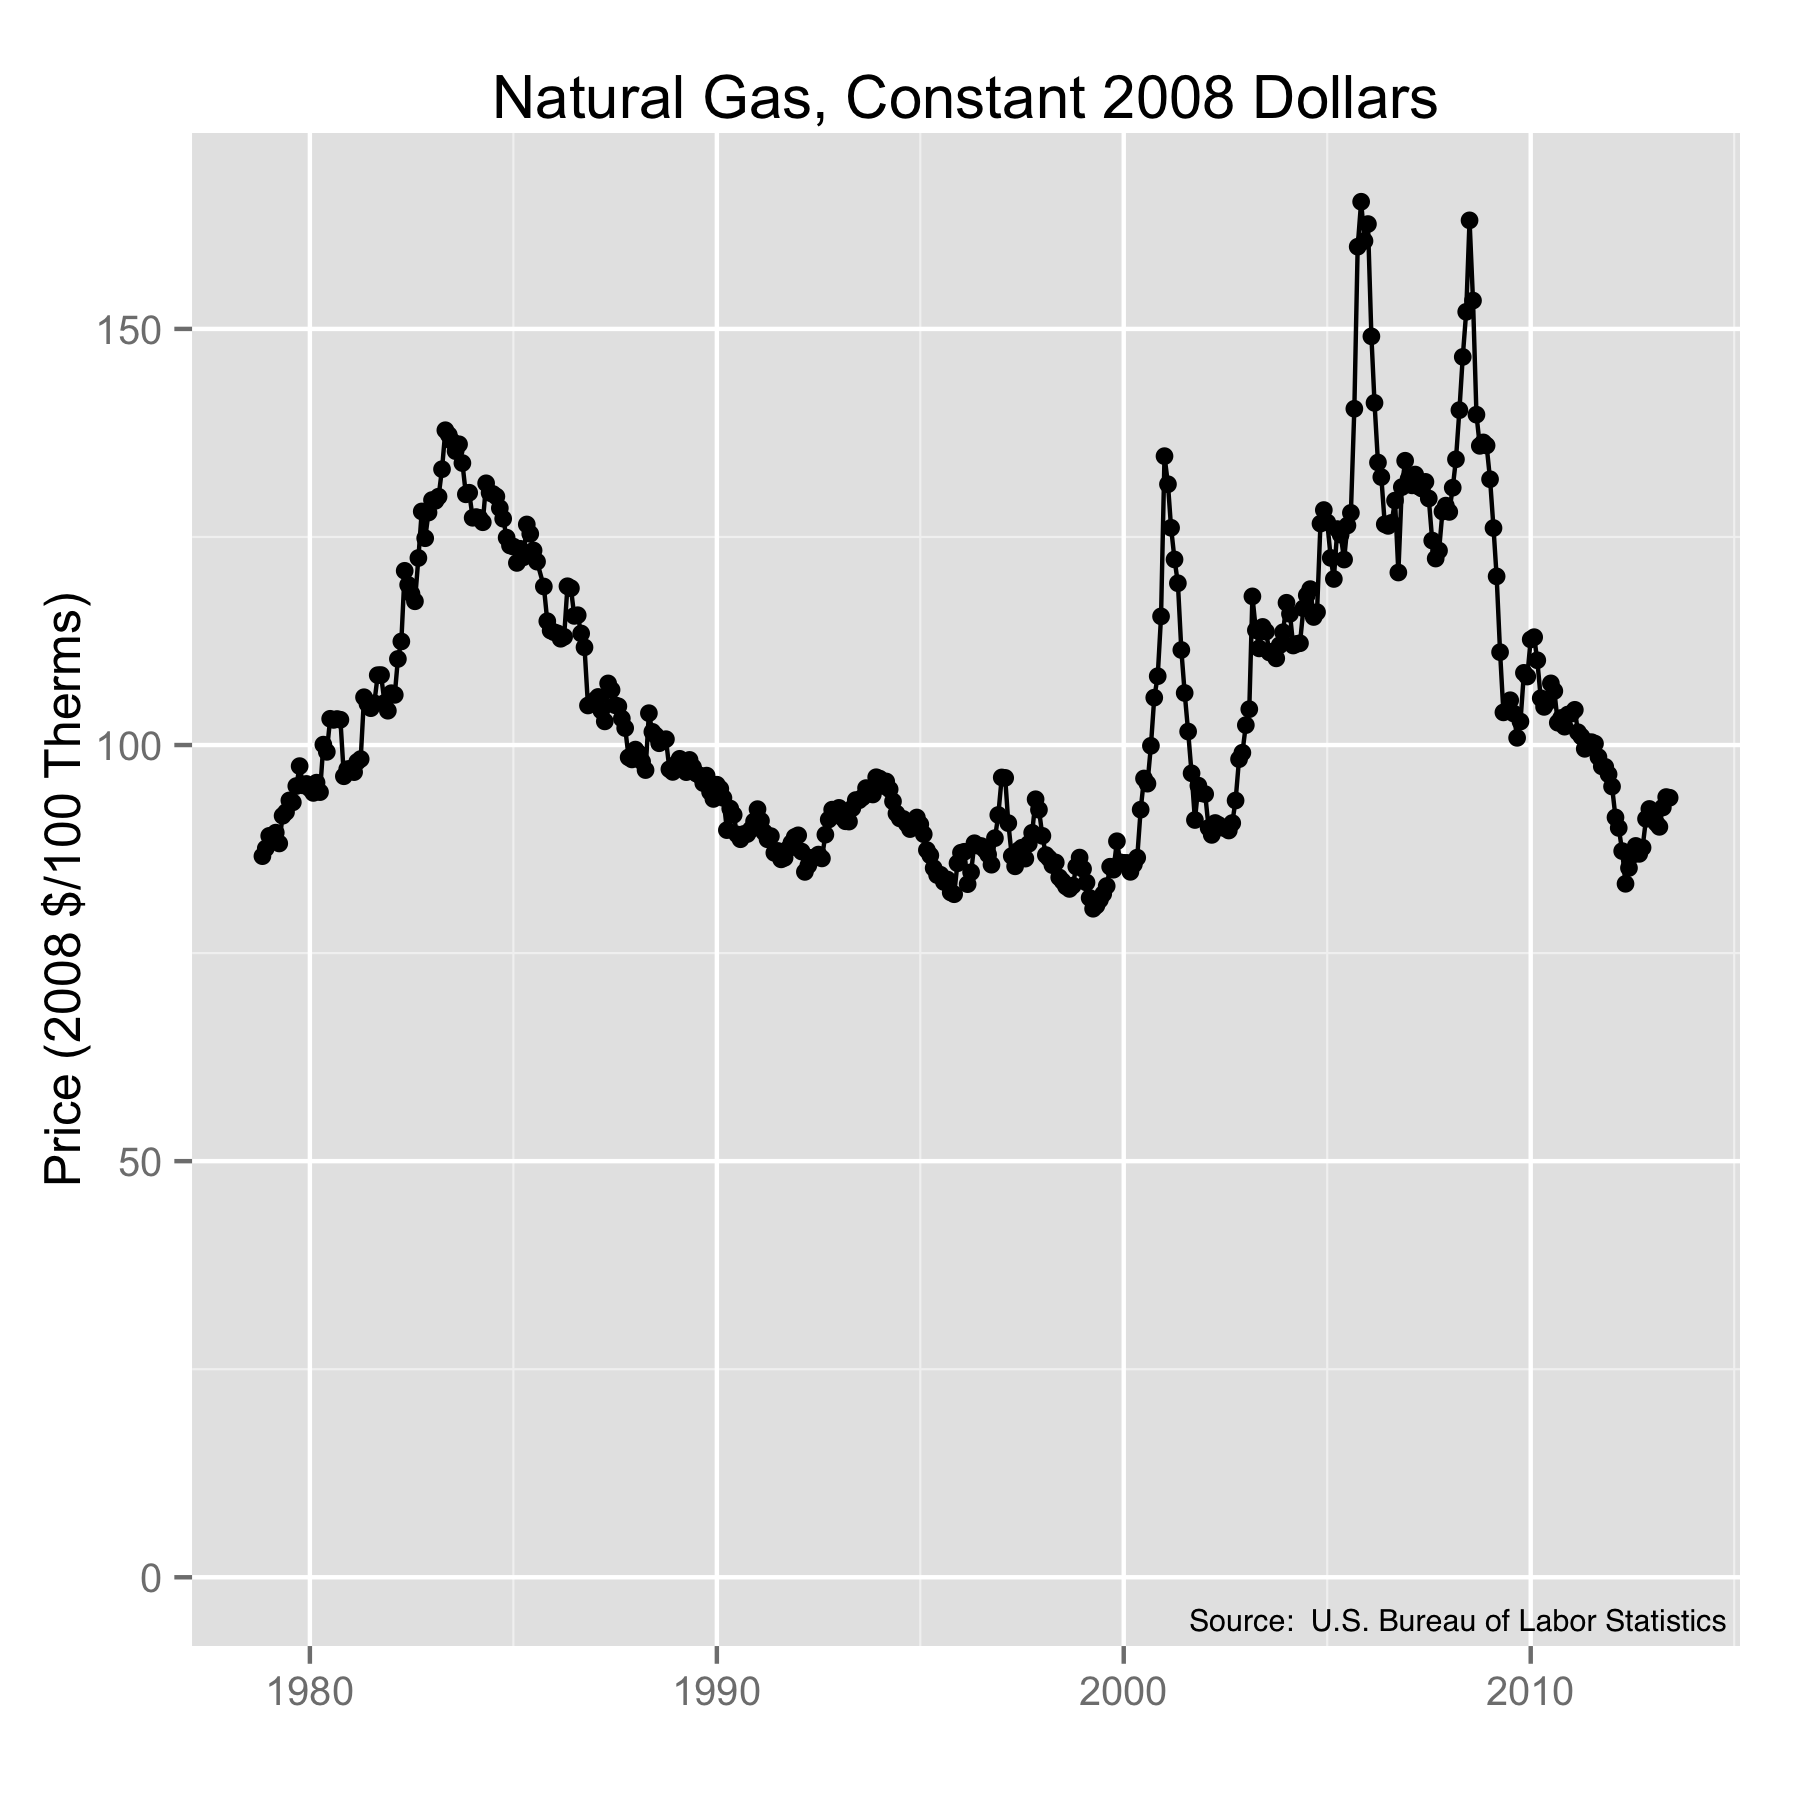
Natural gas prices from 1980 to 2014 in constant 2008 dollars. Source: U.S. Bureau of Labor Statistics.
So what does this tell us? First, that someone has to be making some serious money in the ground beef industry. The inflation-adjusted cost of ground beef is growing well above the rate of inflation, and I’ll bet that the difference is being pocketed by someone clever enough to pull it off. Second, I was surprised to see how some of the inflation-adjusted prices have actually declined. My instincts were to guess that I would see most costs on the rise, but flat or decreasing costs seem to be the rule and not the exception. This is, of course, a simple survey rather than an all-encompassing study. For all I know, every other product is skyrocketing. Given the slope of the inflation curve, retail prices are doing a good job of increasing at the register. May your income increase ever faster.

One thought on “The Cost of Things: A Constant-Dollar Look at Common Goods”