A quick web search shows that I’m not the only one who’s heard the talk about how gasoline prices always decline before an upcoming election. Of course, this always gets mentioned when local gas prices are declining and an election is coming up. But is this actually true? Do gas prices in the United States decrease leading up to an election? There are lots of articles written about this topic, and some even use numbers and statistics to back up their position, but I intend to be a bit more thorough here.
To get started, we’ll use the inflation-adjusted price of gasoline that we get from the U.S. Bureau of Labor Statistics. We’ve looked at these data in a previous post, and if you’re at all interested in how constant-dollar costs are calculated, you should go read that post first. This dataset goes back to 1976, so it includes a sizable number of election years. Nineteen, to be precise. It is important to use inflation adjusted data in this analysis because it compensates for the price changes from the changing buying power of the dollar. Ten cent changes in the price of gas in 1980 and in 2010 aren’t the same, and inflation-adjusted prices account for this.

Unleaded regular gasoline prices from 1980 to 2014 in constant 2008 dollars. Source: U.S. Bureau of Labor Statistics.
The first thing we should do is to look for annual trends. It is entirely reasonable to expect that the price of gas shows some regular changes each year, so we should first understand if this happens and by how much so that we can account for it in our analysis. To do this, we break the above graph up into its parts. We separate the observed data into the parts that repeat on an annual basis (seasonal changes), the parts that change more slowly (long-term trend), and the parts that change more quickly (remainder). If we add these all parts back together we will get the original observation. For gasoline, this additive decomposition gives us the results plotted below. Note the differences in the y-axis scales for the different plots. The “trend” component is the largest. Seasonal variations swing about seventeen cents from high to low, but the remainder, the fast-changing non-periodic fluctuations, can be in excess of a dollar, though they generally exist inside of a quarter of a dollar on either side of zero.
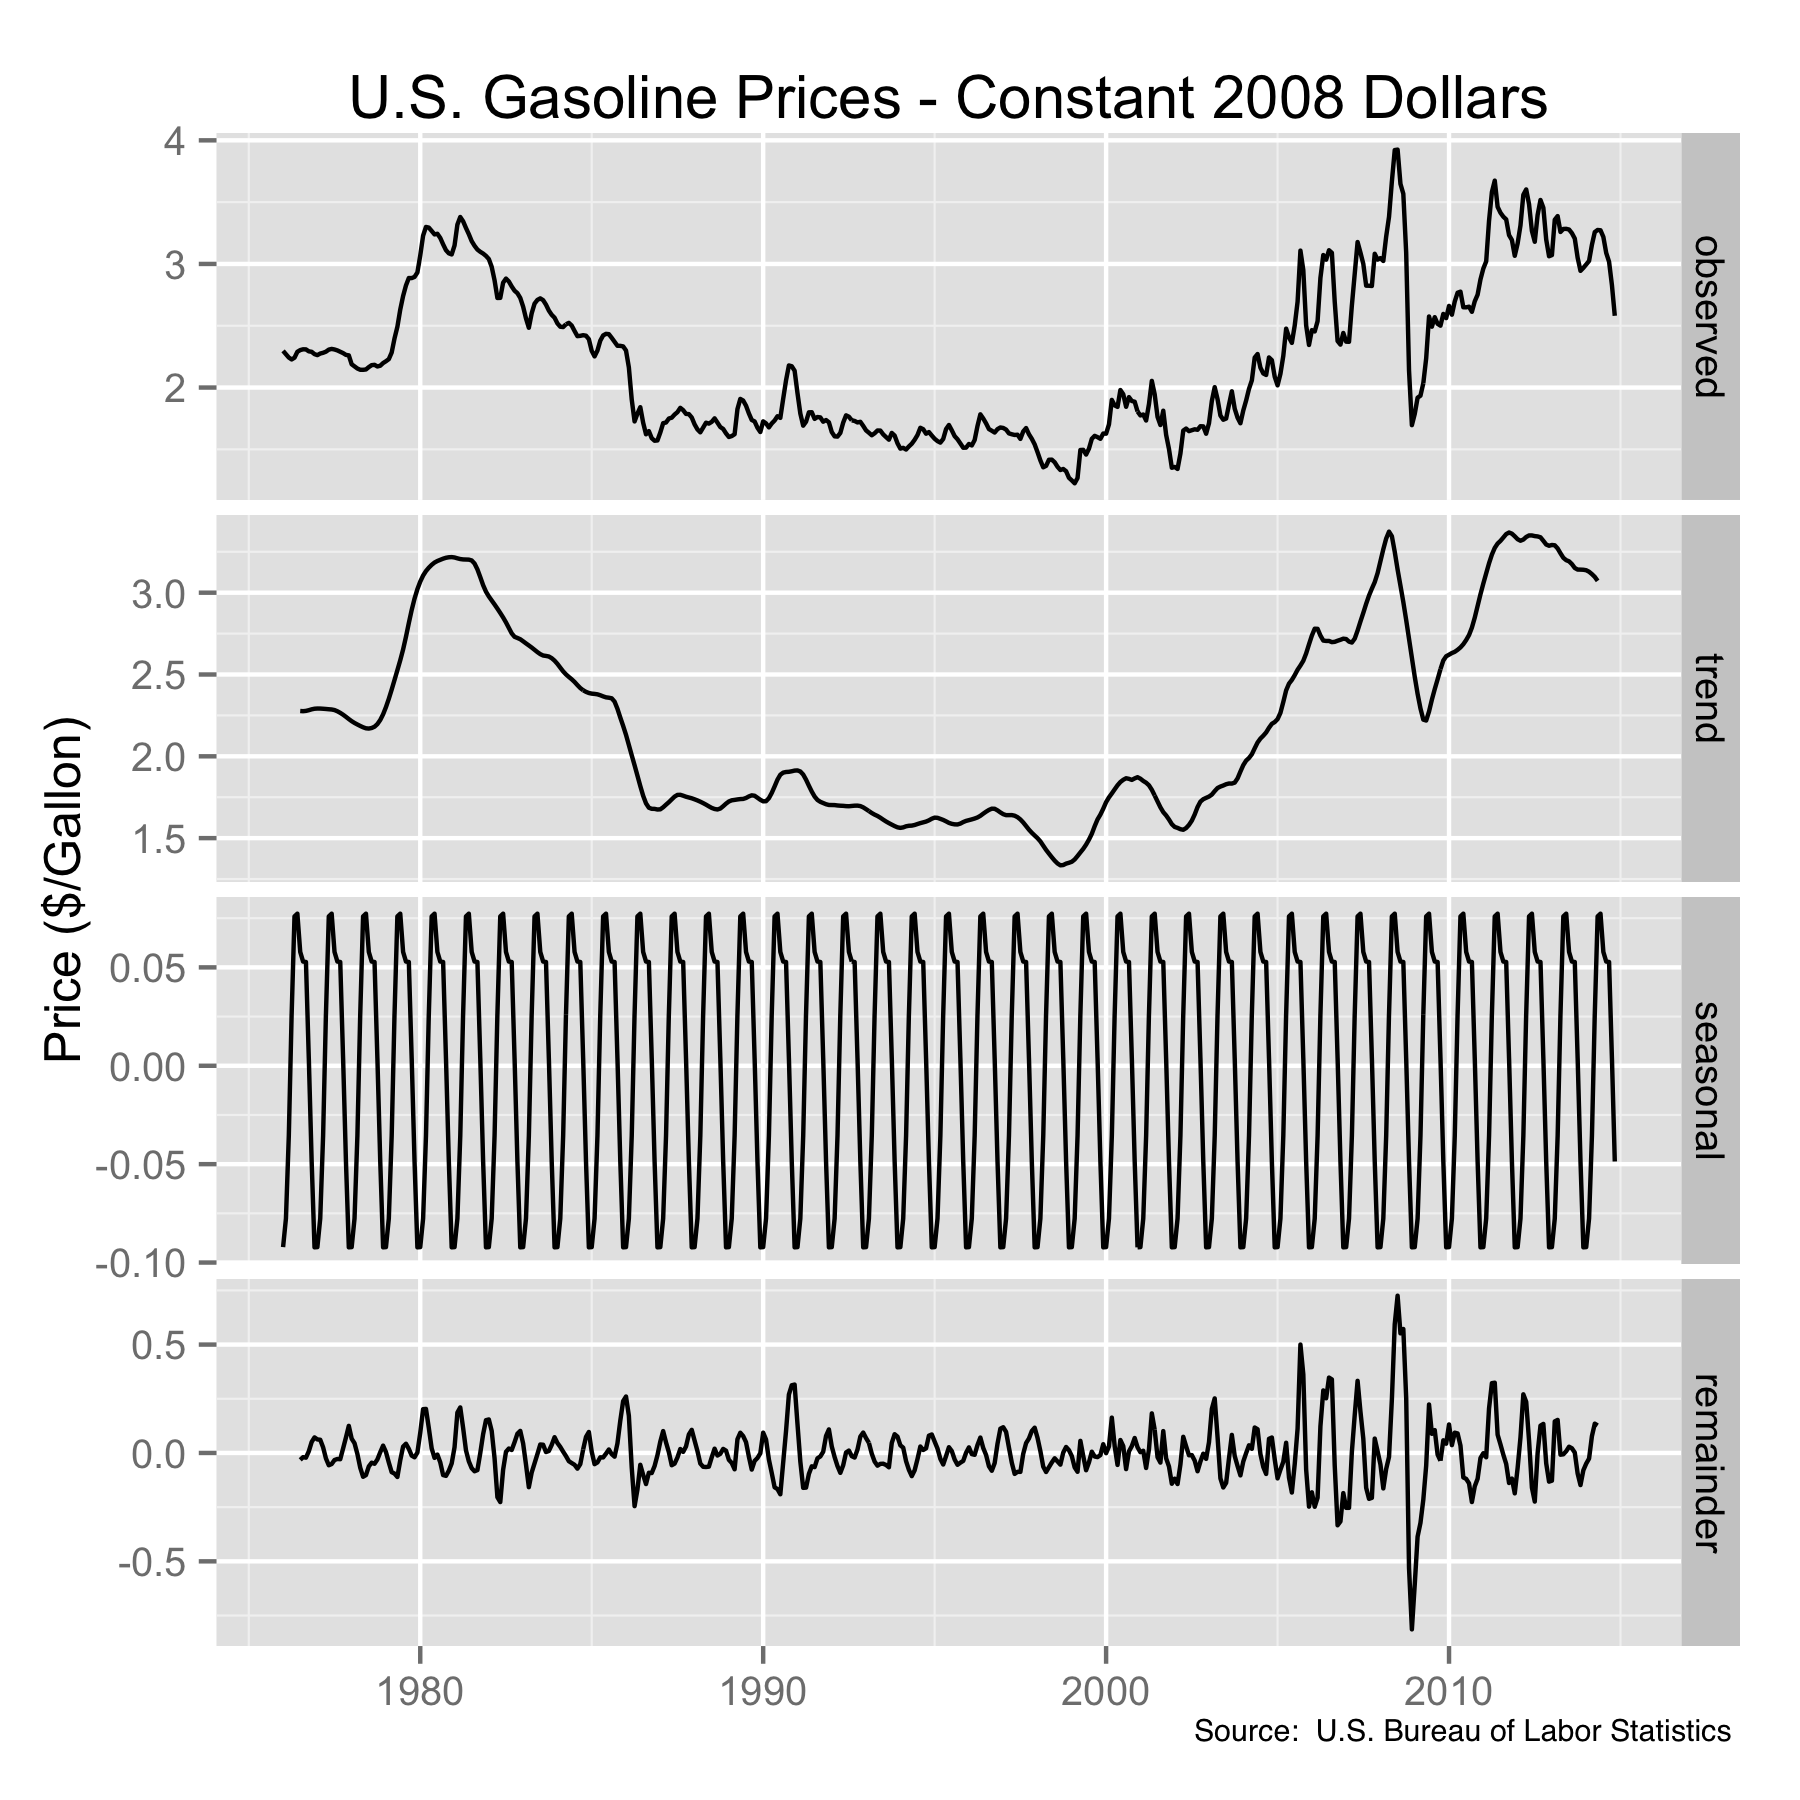
Decomposition of U.S. Gasoline prices into seasonal and other components. Original data source: U.S. Bureau of Labor Statistics.
The seasonal component here is the part we’re interested in first. There are a couple of ways to extract this component in a decomposition, but because we are using constant-dollar prices and looking for the true seasonal fluctuations, we don’t want to window the filter at all. So let’s take a closer look at that seasonal component. Recall that this is the component that occurs repeatably every year since 1976.

Seasonal change in U.S. gasoline prices (regular unleaded) in constant 2008 dollars. Original source: U.S. Bureau of Labor Statistics.
Not too surprisingly, we see there is a 7.7 cent increase in the summer, peaking in the June driving season, and a 9.2 cent decrease in gas prices in the winter, with the bottom arriving in December. Interestingly, since elections are in November, they occur during the natural seasonal price decline. This will not be a problem for us.
The key to determining whether or not non-seasonal conditions (i.e., elections) impact prices is simply to use the non-seasonal components of the prices for comparison. That is, by considering only the trend and remainder components. By excluding the seasonal fluctuations we can see how the non-seasonal prices changed, and from there the effect of elections on price changes will be able to be observed.
For the sake of simplicity, let’s define the time before the election that we are interested in to August through November. This is an assumption on my part. But the last quarter before the election seems to be the time we should pay the most attention to. We can repeat the analysis using any other window of time if we desire. Since we’ve already identified the seasonal changes in the decomposition, this is straightforward. I’ve highlighted the pre-election time on the following graph for ease of viewing.

Non-seasonal changes in U.S. regular unleaded gasoline prices, in constant 2008 dollars during election years from 1976 to 2012. Original source: U.S. Bureau of Labor Statistics.
So when we do this we find the following for election year, non-seasonal gas price changes:
- 1976: +$0.08/gallon
- 1978: +$0.09/gallon
- 1980: -$0.02/gallon
- 1982: No Change
- 1984: +$0.10/gallon
- 1986: +$0.05/gallon
- 1988: +$0.02/gallon
- 1990: +$0.37/gallon
- 1992: +$0.09/gallon
- 1994: +$0.07/gallon
- 1996: +$0.10/gallon
- 1998: +$0.07/gallon
- 2000: +$0.14/gallon
- 2002: +$0.12/gallon
- 2004: +$0.21/gallon
- 2006: -$0.64/gallon
- 2008: -$1.40/gallon
- 2010: +$0.20/gallon
- 2012: -$0.10/gallon
So only four out of the last 19 election years have shown a drop in gas prices that were not part of the normal seasonal variation. And only two of those were by more than a dime. The average change here is a 2.3 cent drop, but that is very heavily influenced by the 2008 drop of $1.40/gallon, statistically an outlier. The median value of an 8.1 cent increase is more in line with the typical behavior. And of the years when the prices don’t drop, the average increase is 11.5 cents. In other words, there is no election-year drop in gasoline prices using the BLS data.
We should ask ourselves how these election year results differ from those of non-election years. This is also straightforward to answer.

Non-seasonal changes in U.S. regular unleaded gasoline prices, in constant 2008 dollars during non-election years from 1977 to 2013. Original source: U.S. Bureau of Labor Statistics.
And we find the following non-election year, non-seasonal gas price change results (August to November):
- 1977: +$0.06/gallon
- 1979: +$0.17/gallon
- 1981: +$0.04/gallon
- 1983: -$0.02/gallon
- 1985: +$0.04/gallon
- 1987: +$0.05/gallon
- 1989: -$0.01/gallon
- 1991: +$0.08/gallon
- 1993: +$0.11/gallon
- 1995: +$0.01/gallon
- 1997: +$0.04/gallon
- 1999: +$0.10/gallon
- 2001: -$0.09/gallon
- 2003: No Change
- 2005: -$0.09/gallon
- 2007: +$0.35/gallon
- 2009: +$0.13/gallon
- 2011: -$0.09/gallon
- 2013: -$0.20/gallon
And so we find that just six of the nineteen non-election years showed August to November gas price decreases, and only one of those was more than a dime drop. The average price change in non-election years is a 3.6 cent increase with the median value of a 3.8 cent increase (it is nice when they agree). And for the years that show an increase, the average change is a rise of 9.9 cents. I think it is easier to grasp this visually.

Non-seasonal, August to November changes in U.S. regular unleaded gasoline prices from 1976 to 2013. The comparison is made for election and non-election years. Original data source is the U.S. Bureau of Labor Statistics.
This tells us that the non-seasonal median gas price change between August and November in an election year actually increases by 4.3 cents/gallon (in constant 2008 dollars) in an election year compared to the same time frame in a non-election year. The caveat here is that we are dealing with national prices instead of local, but I think we can call this myth busted.

One thought on “The Effect of Elections on Gasoline Prices”